

Next: AVO
Up: Boyd: Systematic AVO response
Previous: DATA
classes
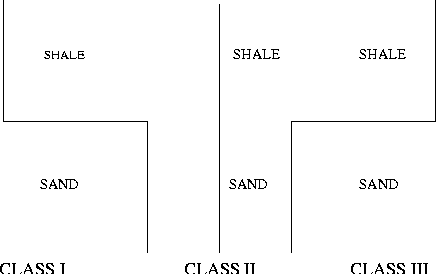
Figure 3 The three classes of reflectivity. The upper
layer is a sand layer and the lower layer is a shale layer. Plotted to the
right is impedance and depth is down. The shallow sections of the well exhibit Class III behavior. At 2.4 km the well exhibits
Class II behavior and the deepest sections display Class I behavior.

The three classes of reflectivity are shown in Figure 3. The Vp, Vs and
 (density) of shale as a function of depth were all fitted to straight
lines. Subsequently, the same three properties (Vp, Vs and
 ) of sand were fitted to straight lines. I picked three
different depths at which to calculate these six well properties. I then
used these values to construct simplistic two-layer models. The depths used
were two, 2.4 and four kilometers below the surface. The medium depth (2.4 km) was
chosen specifically because it is the crossover point (Vp(sand)=Vp(shale)) and therefore, a Class II reflection. The shallow and deep depths were simply chosen to be depths significantly
far from 2.4 kilometers and on opposing sides. Looking at Table 1, it
is obvious that the depth closest to the surface is an example of Class III reflectivity as Vp(shale)>Vp(sand). For similar reasons, the deepest portion is a class
I well as Vp(shale)<Vp(sand).
This is obviously an example of Class II reflectivity.


Next: AVO
Up: Boyd: Systematic AVO response
Previous: DATA
Stanford Exploration Project
11/11/1997
