of the Mobil AVO data set
![[*]](http://sepwww.stanford.edu/latex2html/foot_motif.gif)
![[*]](http://sepwww.stanford.edu/latex2html/prev_gr.gif)
![[*]](http://sepwww.stanford.edu/latex2html/foot_motif.gif)
![[*]](http://sepwww.stanford.edu/latex2html/foot_motif.gif) ,
Christine Ecker,
,
Christine Ecker, ![[*]](http://sepwww.stanford.edu/latex2html/foot_motif.gif) and Arnaud Berlioux
and Arnaud Berlioux
ABSTRACTMobil Oil has released a comprehensive seismic and well-log data set from the North Sea to benchmark AVO techniques. We present our results on amplitude-preserved data processing and analysis of the Mobil AVO data. First, we apply a source and receiver consistent amplitude balancing to the seismic data, which reduces source and receiver amplitude variance from about 8% and 15% respectively, to within a few percent scatter. Next, we apply a time-domain conjugate-gradient multiple-suppression technique to remove multiple reflection energy and simultaneously preserve and enhance primary-reflection AVO amplitudes. We perform unmigrated AVO analyses and find that the multiple-suppressed data correlate better with the well-log data than the unprocessed data. A prestack migration/inversion of the multiple-suppressed data shows a clear improvement over unmigrated AVO analysis, and reveals an undrilled graben block in the center of the line that exhibits a positive hydrocarbon indicator anomaly. |
INTRODUCTION
Mobil Oil has released a comprehensive seismic and well-log data set as an open benchmark of AVO techniques. We initially found that the data were so heavily contaminated with multiple reflections (water-column peglegs), that it would be nearly impossible to perform a reasonable AVO analysis without first removing multiples. However, this must be done in a manner which simultaneously preserves the primary AVO response. This led directly to a new method for amplitude-preserved multiple suppression developed by Lumley, Nichols and Rekdal . We believe this method to be a new practical tool useful for suppressing multiple reflections without compromising subsequent AVO analysis.
We were also surprised to find that raw source and receiver consistent amplitude variations were as high as 10% and 20% respectively. These source-receiver amplitude variations cause undesirable scatter in AVO amplitude analysis, and can smear any attempt at amplitude-preserved multiple suppression or prestack migration. This led Lumley and Berlioux to develop a quick and robust method for estimating and applying the necessary source-receiver amplitude corrections.
We demonstrate the effects of amplitude balancing, multiple suppression, conventional unmigrated AVO analysis, and a prestack migration/inversion method. We show a distinct improvement in the quality of AVO information after multiple suppression, and in comparing prestack migration/inversion results to conventional unmigrated AVO analysis.
AMPLITUDE BALANCING
Amplitude variations
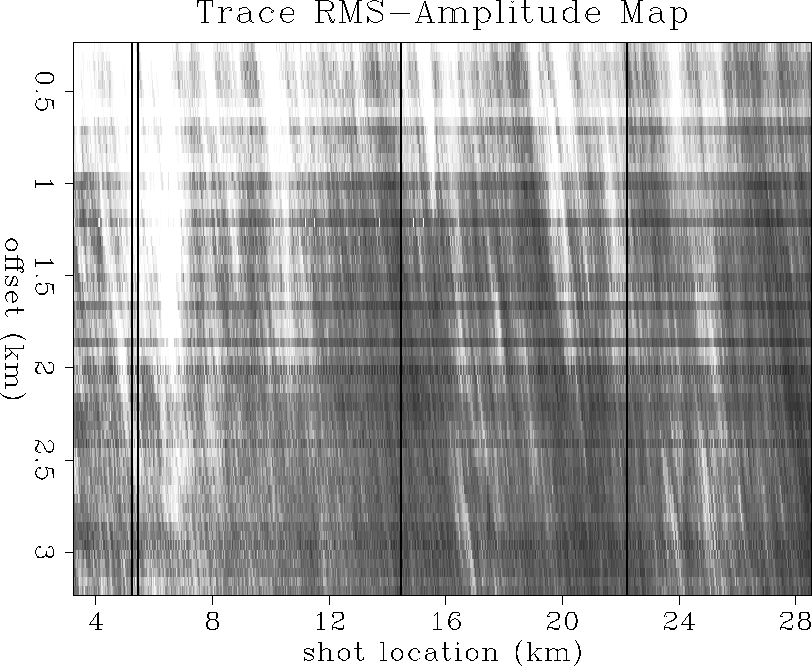
Figure ![[*]](http://sepwww.stanford.edu/latex2html/cross_ref_motif.gif) is a display of trace rms-amplitude
as a function of shot position and offset.
The trace amplitude is calculated in a triangular-tapered window
on each trace from 5-6 seconds record time, after geometric spreading and
NMO corrections. The late time of this window helps to suppress the
effects of source-receiver directivity since most reflection energy
is propagating near-vertical at all offsets. It also avoids
spatially-variable reflection signal biasing the trace amplitude estimate
since most energy is incoherent noise at these late arrival times.
The dark vertical stripes in
Figure
is a display of trace rms-amplitude
as a function of shot position and offset.
The trace amplitude is calculated in a triangular-tapered window
on each trace from 5-6 seconds record time, after geometric spreading and
NMO corrections. The late time of this window helps to suppress the
effects of source-receiver directivity since most reflection energy
is propagating near-vertical at all offsets. It also avoids
spatially-variable reflection signal biasing the trace amplitude estimate
since most energy is incoherent noise at these late arrival times.
The dark vertical stripes in
Figure ![[*]](http://sepwww.stanford.edu/latex2html/cross_ref_motif.gif) correspond to missing shots in the data set.
Each horizontal band corresponds to a single hydrophone group
(receiver) in the marine cable,
and the grayscale value shows the variable amplitude
sensitivity of receivers along the cable. For example, the two
adjacent dark gray horizontal stripes at about 1 km offset
represent two hydrophone groups which are relatively weak compared
to other receiver groups. The overall amplitude variations
are on the order of 10-20% of the average amplitude in the plane, and
may cause undesirable systematic scatter in any amplitude-preserved
processing step or AVO analysis.
Shot and receiver consistent amplitude balancing is required to
suppress this undesirable amplitude contamination.
correspond to missing shots in the data set.
Each horizontal band corresponds to a single hydrophone group
(receiver) in the marine cable,
and the grayscale value shows the variable amplitude
sensitivity of receivers along the cable. For example, the two
adjacent dark gray horizontal stripes at about 1 km offset
represent two hydrophone groups which are relatively weak compared
to other receiver groups. The overall amplitude variations
are on the order of 10-20% of the average amplitude in the plane, and
may cause undesirable systematic scatter in any amplitude-preserved
processing step or AVO analysis.
Shot and receiver consistent amplitude balancing is required to
suppress this undesirable amplitude contamination.
 |
Amplitude model
Lumley and Berlioux present their results of source- and receiver-consistent trace amplitude balancing. Their method first removes the low-wavenumber geologic trend from source- and receiver-consistent amplitude terms by 2-D median filtering to remove noise spikes, followed by triangular smoothing of the trace rms-amplitude plane. Then the shot and receiver correction coefficients are calculated by stacking logarithmic trace amplitudes along the shot and receiver axes separately.
The method is based on a simple theoretical model of trace rms amplitudes:
| |
(1) |
This model is similar to that of Taner and Koehler ,
where At is the trace rms amplitude response at a particular
shot and receiver location ![]() and
and ![]() , given as the product of a
source-consistent term As, a receiver-consistent term Ar, and
non-source-receiver-consistent terms caused by variable-reflection-strength
earth geology Ae and random or coherent noise An.
A 2-D map of At can be made by finding the rms
amplitude of samples at each
, given as the product of a
source-consistent term As, a receiver-consistent term Ar, and
non-source-receiver-consistent terms caused by variable-reflection-strength
earth geology Ae and random or coherent noise An.
A 2-D map of At can be made by finding the rms
amplitude of samples at each ![]() trace location within a specified
time gate, as previously described, and shown in Figure
trace location within a specified
time gate, as previously described, and shown in Figure ![[*]](http://sepwww.stanford.edu/latex2html/cross_ref_motif.gif) .
.
Regional geology trend
It is convenient to express (1) as a sum in the logarithmic domain,
| |
(2) |
where
| (3) |
If an estimate can be made of the amplitude
component due to variable reflection geology strength, ![]() ,
then this regional geologic trend can be subtracted from (2)
resulting in,
,
then this regional geologic trend can be subtracted from (2)
resulting in,
| |
(4) |
where we further assume ![]() has been scaled to a mean value of unity.
has been scaled to a mean value of unity.
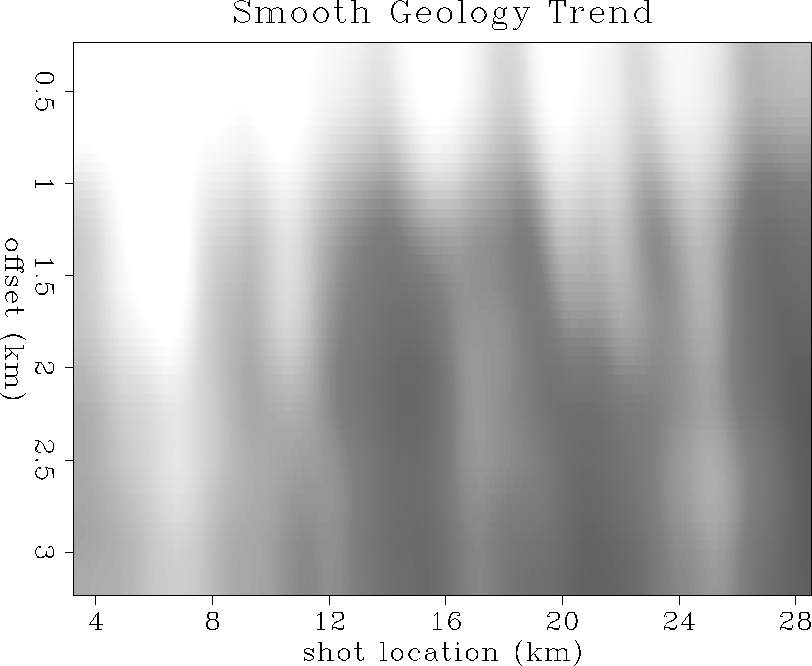
We estimate the geology contribution ![]() by first median-filtering
the trace amplitude map
by first median-filtering
the trace amplitude map ![]() to remove noise spikes,
and then smooth
the result with a 2-D triangular operator to get the low spatial-frequency
trend. Our estimate of Ae obtained this way is shown in Figure
to remove noise spikes,
and then smooth
the result with a 2-D triangular operator to get the low spatial-frequency
trend. Our estimate of Ae obtained this way is shown in Figure ![[*]](http://sepwww.stanford.edu/latex2html/cross_ref_motif.gif) .
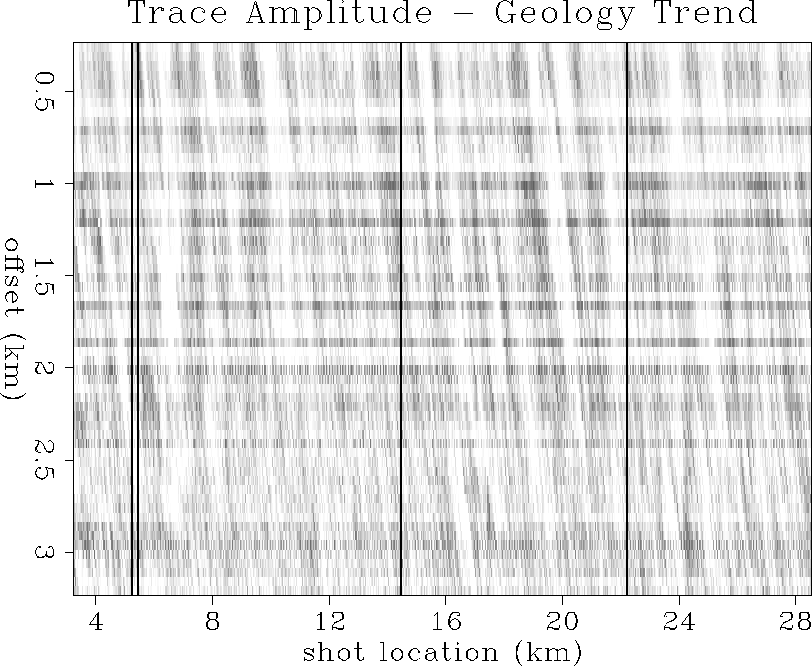
The estimate of the trace amplitude without the bias of the geologic trend,
.
The estimate of the trace amplitude without the bias of the geologic trend,
![]() , is shown in Figure
, is shown in Figure ![[*]](http://sepwww.stanford.edu/latex2html/cross_ref_motif.gif) . This is equivalent to
dividing the image of Figure
. This is equivalent to
dividing the image of Figure ![[*]](http://sepwww.stanford.edu/latex2html/cross_ref_motif.gif) by the image in Figure
by the image in Figure ![[*]](http://sepwww.stanford.edu/latex2html/cross_ref_motif.gif) ,
or subtracting in the logarithmic domain.
The 2-D geologic trend removal has highlighted the horizontal bands
related to receiver amplitude variation.
,
or subtracting in the logarithmic domain.
The 2-D geologic trend removal has highlighted the horizontal bands
related to receiver amplitude variation.
 |
 |
Shot and receiver coefficients
If the noise an is uncorrelated in both the shot and receiver axis
directions, then estimates of the source and receiver amplitude balancing
coefficients as and ar can be obtained by directional stacking
in the ![]() plane.
Normalized stacking along the shot axis gives an estimate of ar,
plane.
Normalized stacking along the shot axis gives an estimate of ar,
| |
(5) |
if as and an are uncorrelated and zero-mean in the shot direction. Similarly, stacking along the receiver axis gives an estimate of as,
| |
(6) |
if ar and an are uncorrelated and zero-mean in the receiver direction.
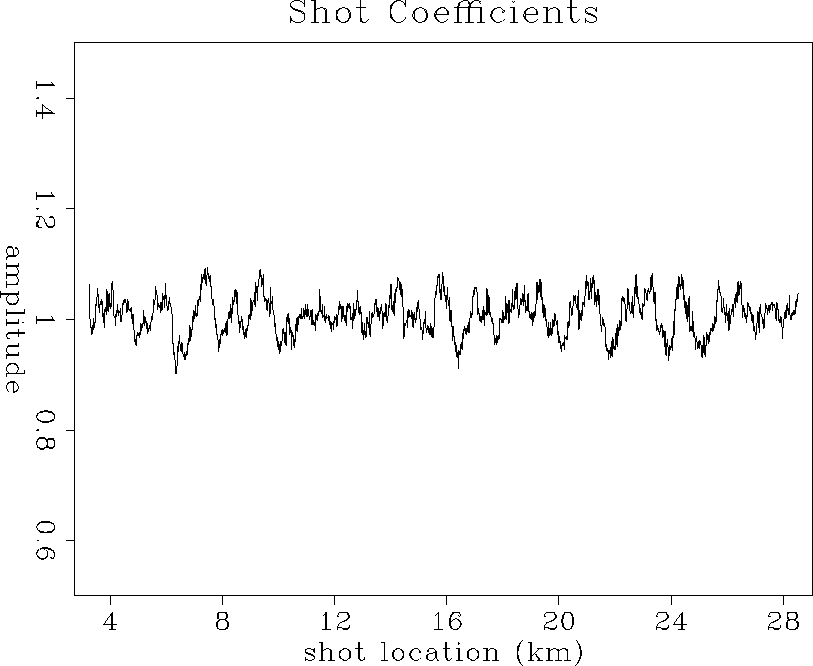
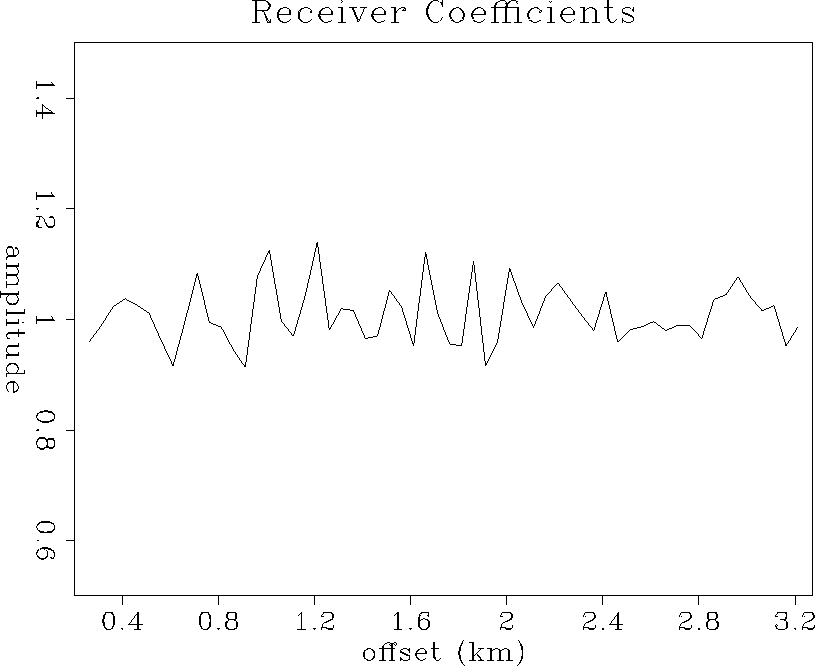
The estimated shot and receiver coefficients are plotted in Figures
![[*]](http://sepwww.stanford.edu/latex2html/cross_ref_motif.gif) and
and ![[*]](http://sepwww.stanford.edu/latex2html/cross_ref_motif.gif) respectively. These are obtained by stacking
Figure
respectively. These are obtained by stacking
Figure ![[*]](http://sepwww.stanford.edu/latex2html/cross_ref_motif.gif) along the receiver and shot axes respectively.
The shot coefficients
vary in amplitude less than 10% due to varying source strength,
whereas the receiver coefficients vary up to almost 20% due to
variable group cable sensitivity.
along the receiver and shot axes respectively.
The shot coefficients
vary in amplitude less than 10% due to varying source strength,
whereas the receiver coefficients vary up to almost 20% due to
variable group cable sensitivity.
Amplitude balanced results
The final amplitude balancing coefficients ![]() and
and ![]() can be obtained by exponentiating and inverting as and ar:
can be obtained by exponentiating and inverting as and ar:
| (7) |
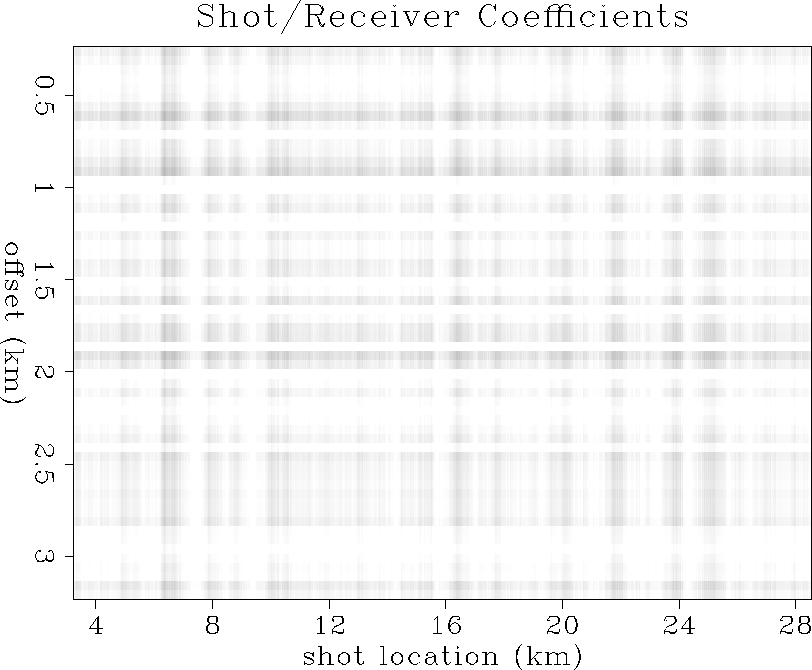
A plot of the combined source-receiver coefficients, ![]() is shown in Figure
is shown in Figure ![[*]](http://sepwww.stanford.edu/latex2html/cross_ref_motif.gif) . Both vertical (source)
and horizontal (receiver) stripes are clearly visible.
Each seismic trace
. Both vertical (source)
and horizontal (receiver) stripes are clearly visible.
Each seismic trace ![]() can now be balanced in a
source-receiver-consistent manner such that
can now be balanced in a
source-receiver-consistent manner such that
| |
(8) |
where ![]() is the balanced trace data.
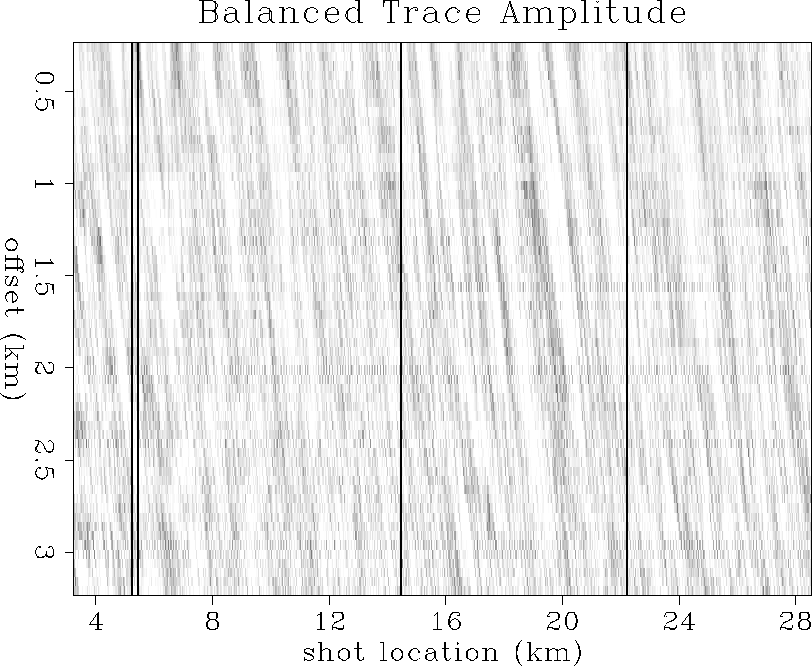
Figure
is the balanced trace data.
Figure ![[*]](http://sepwww.stanford.edu/latex2html/cross_ref_motif.gif) shows the source- and receiver-consistent balanced
trace amplitude map.
By direct comparison with Figure
shows the source- and receiver-consistent balanced
trace amplitude map.
By direct comparison with Figure ![[*]](http://sepwww.stanford.edu/latex2html/cross_ref_motif.gif) , we can see that
the original source and receiver variations have been largely suppressed.
, we can see that
the original source and receiver variations have been largely suppressed.
 |
 |
 |
 |
MULTIPLE SUPPRESSION
Multiple contamination
Water-bottom pegleg multiples distort primary reflections
and contaminate the AVO character in the Mobil data.
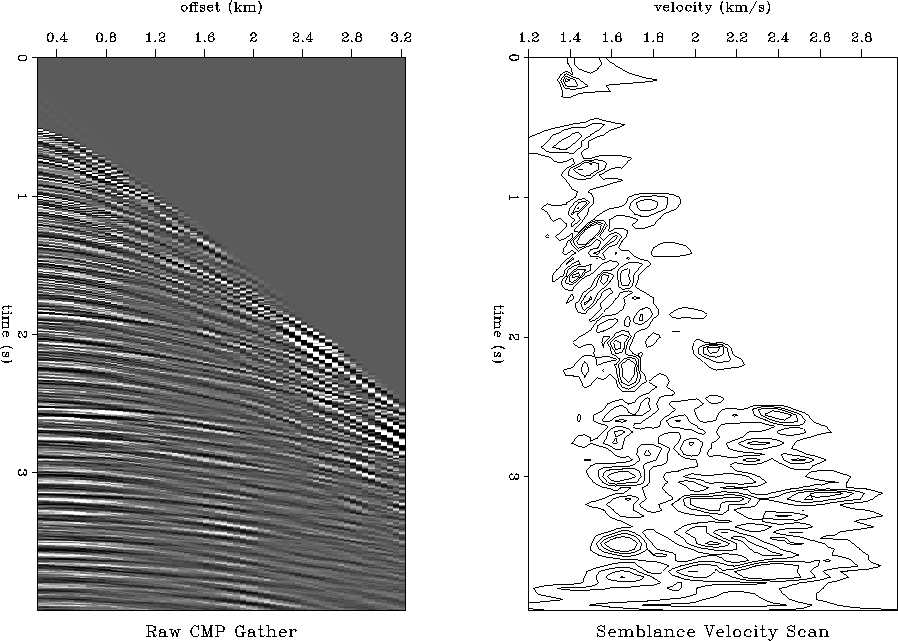
The adverse effects of multiples can be seen in the raw CMP gather
and its semblance scan in Figure ![[*]](http://sepwww.stanford.edu/latex2html/cross_ref_motif.gif) . From drilling
results, two reservoir target reflections are expected to be visible
at about 2.1 and 2.6 seconds in the data, but they are almost completely
masked by water-bottom pegleg multiple reflections.
The companion velocity scan shows strong semblance energy associated
with multiples at a wide range of traveltimes and stacking velocities,
which contaminates primary stacking velocity analysis.
Before accurate velocity, AVO and migration/inversion analysis can be
performed,
multiple reflection events need to be suppressed from the data while
simultaneously preserving primary reflection AVO amplitudes.
. From drilling
results, two reservoir target reflections are expected to be visible
at about 2.1 and 2.6 seconds in the data, but they are almost completely
masked by water-bottom pegleg multiple reflections.
The companion velocity scan shows strong semblance energy associated
with multiples at a wide range of traveltimes and stacking velocities,
which contaminates primary stacking velocity analysis.
Before accurate velocity, AVO and migration/inversion analysis can be
performed,
multiple reflection events need to be suppressed from the data while
simultaneously preserving primary reflection AVO amplitudes.
 |
Multiple-suppression method
Lumley, Nichols and Rekdal present their method of amplitude-preserved multiple suppression. An iterative time-domain conjugate gradient scheme is used to invert for a velocity scan which ``fits'' its associated CMP gather to within a few percent misfit error, when a hyperbolic forward modeling operator is applied to that velocity scan. This ensures that most amplitude and AVO information is accurately preserved by the velocity transform pair. Next, a primary velocity trend is automatically picked in the scan by a Monte Carlo method, and a semblance mask is designed on this basis to isolate multiple energy in velocity space. The amplitude-preserved multiple-suppressed CMP gather is then obtained by modeling the isolated multiple reflections and subtracting them from the original CMP gather.
Multiple-suppression theory
The method is based upon a space-time operator which models
both multiple and primary reflections as time-variant Dix hyperbolas.
The hyperbolic summation/scatter operator ![]() maps points in the velocity
model space
maps points in the velocity
model space ![]() to a CMP gather in the seismic data space
to a CMP gather in the seismic data space ![]() :
:
| |
(9) |
where h is source-receiver offset, t is two-way traveltime,
v is Dix rms velocity, and ![]() is two-way vertical
traveltime (pseudodepth).
Since the operator
is two-way vertical
traveltime (pseudodepth).
Since the operator ![]() resides in the
space-time domain, it has the advantage of being able to accurately
avoid frequency-domain artifacts arising from data mute zones and dead traces.
Furthermore, the hyperbolic operator allows non-stationary use of offset,
time and cosine operator weighting, as well as rho-filter spectral shaping.
resides in the
space-time domain, it has the advantage of being able to accurately
avoid frequency-domain artifacts arising from data mute zones and dead traces.
Furthermore, the hyperbolic operator allows non-stationary use of offset,
time and cosine operator weighting, as well as rho-filter spectral shaping.
The time-variant nature of the hyperbolic operator allows for optimal separation of primary and multiple velocity energy compared to slant-stack (), parabolic (), or time-shifted hyperbolic methods, Foster and Mosher . Optimal velocity separation is critical for all multiple suppression techniques based on moveout velocity difference, in both a kinematic and dynamic sense. The method is not as theoretically accurate as wave-equation derived scattering () or surface-consistent methods (), but is potentially orders of magnitude faster and more stable in practical applications. This is because wave-equation methods require computing several cascaded terms of the wavefield continuation to stabilize the series expansion, need accurate estimates of the source wavefield, and require estimates of unrecorded near and far offset data to predict late offset-dependent multiple arrivals.
The least-squares estimate of ![]() from (9) requires
minimizing the L2 norm of the residual error,
from (9) requires
minimizing the L2 norm of the residual error,
| |
(10) |
with respect to ![]() .
The method of conjugate gradients ()
provides an iterative L2 approximation
.
The method of conjugate gradients ()
provides an iterative L2 approximation ![]() for the exact
solution
for the exact
solution ![]() .The CG method iterates until a velocity scan
.The CG method iterates until a velocity scan ![]() is found which fits
the data upon forward modeling, to within some specified error tolerance.
At this point of ``practical convergence'', the L2 velocity scan can
be forward-modeled with the scattering operator
is found which fits
the data upon forward modeling, to within some specified error tolerance.
At this point of ``practical convergence'', the L2 velocity scan can
be forward-modeled with the scattering operator ![]() and will accurately
match the input data.
Hence, an amplitude-preserving velocity transform pair has been found.
and will accurately
match the input data.
Hence, an amplitude-preserving velocity transform pair has been found.
Since the time-variant hyperbolic operator is optimal
for separating multiple and primary energy in velocity space,
multiple reflection energy may be isolated and accurately modeled
from the velocity scan ![]() without seriously distorting primary energy.
Multiple reflections modeled this way can then be subtracted from the
input CMP gather, resulting in an amplitude-preserved multiple-suppression
technique.
without seriously distorting primary energy.
Multiple reflections modeled this way can then be subtracted from the
input CMP gather, resulting in an amplitude-preserved multiple-suppression
technique.
Multiple-suppression results
To examine the effectiveness of the multiple-suppression technique, we first tested the method on full-wave synthetic data. Once we were satisfied we had passed this test, we performed multiple suppression to the entire Mobil line. The method is fully automatic in the sense that it requires no manual interactive procedures once the run parameters are optimized (e.g., no interactive design of velocity space masks), and takes about 1 CPU minute per CMP gather on an HP 735 workstation.
Synthetic data
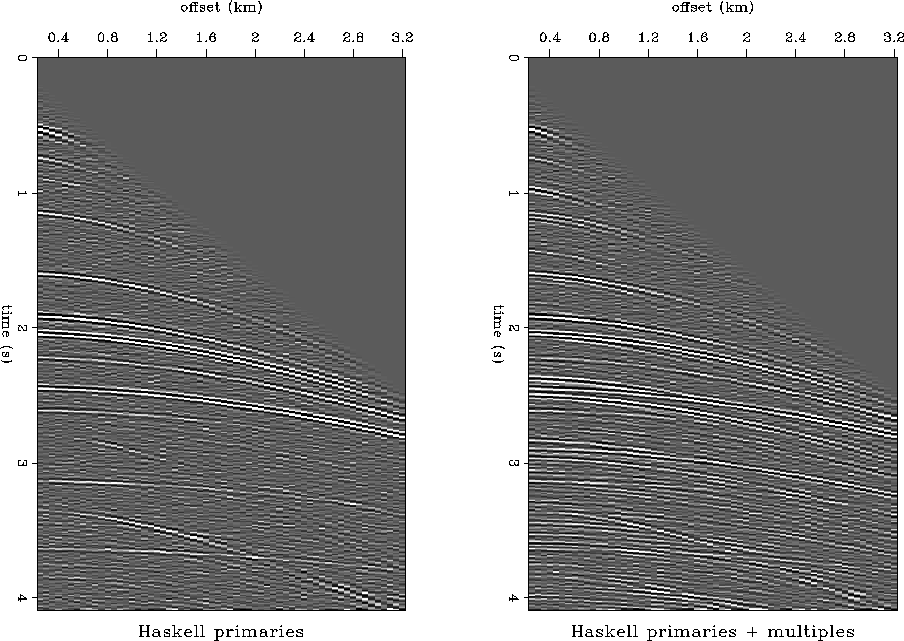
Figure ![[*]](http://sepwww.stanford.edu/latex2html/cross_ref_motif.gif) shows full waveform elastic synthetic seismograms
generated at the Well A location using blocked well-log values and
a 1-D Haskell-Thompson matrix propagator modeling algorithm
().
The left panel show data modeled without free-surface multiples, but
including interbed multiples and both primary and shear-converted
P-wave reflections. The right panel is the same, except it includes
the free-surface multiple reflections.
shows full waveform elastic synthetic seismograms
generated at the Well A location using blocked well-log values and
a 1-D Haskell-Thompson matrix propagator modeling algorithm
().
The left panel show data modeled without free-surface multiples, but
including interbed multiples and both primary and shear-converted
P-wave reflections. The right panel is the same, except it includes
the free-surface multiple reflections.
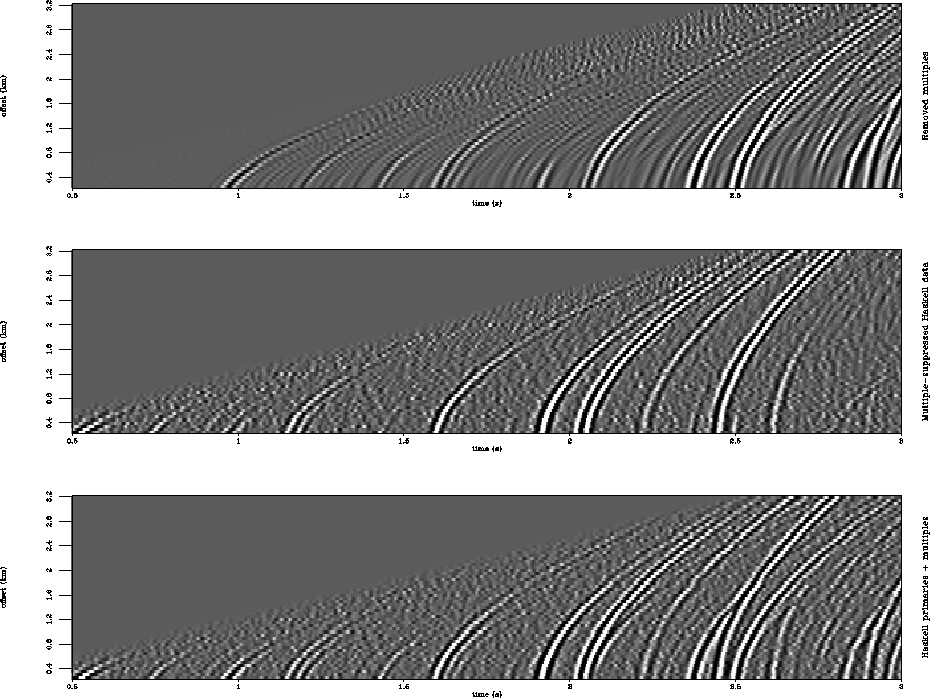
Figure ![[*]](http://sepwww.stanford.edu/latex2html/cross_ref_motif.gif) shows a comparison of the multiple suppression
on the full waveform synthetic data. The left panel shows the
original input data including free-surface multiples, the center
panel is our amplitude-preserved multiple-suppression, and the right
panel is the subtracted estimate of the multiple reflections.
Kinematically, the multiple-suppression has done a good
job at removing multiple reflection events. However, the method also
seems to be very good dynamically in the sense that there is no
obvious amplitude distortion of recovered primary events from near to
far offset. Furthermore, whereas most primary events are fairly
constant in amplitude, the two reservoir reflections at 2.2 and 2.6
seconds have retained the correct (and opposite trend) AVO behavior.
shows a comparison of the multiple suppression
on the full waveform synthetic data. The left panel shows the
original input data including free-surface multiples, the center
panel is our amplitude-preserved multiple-suppression, and the right
panel is the subtracted estimate of the multiple reflections.
Kinematically, the multiple-suppression has done a good
job at removing multiple reflection events. However, the method also
seems to be very good dynamically in the sense that there is no
obvious amplitude distortion of recovered primary events from near to
far offset. Furthermore, whereas most primary events are fairly
constant in amplitude, the two reservoir reflections at 2.2 and 2.6
seconds have retained the correct (and opposite trend) AVO behavior.
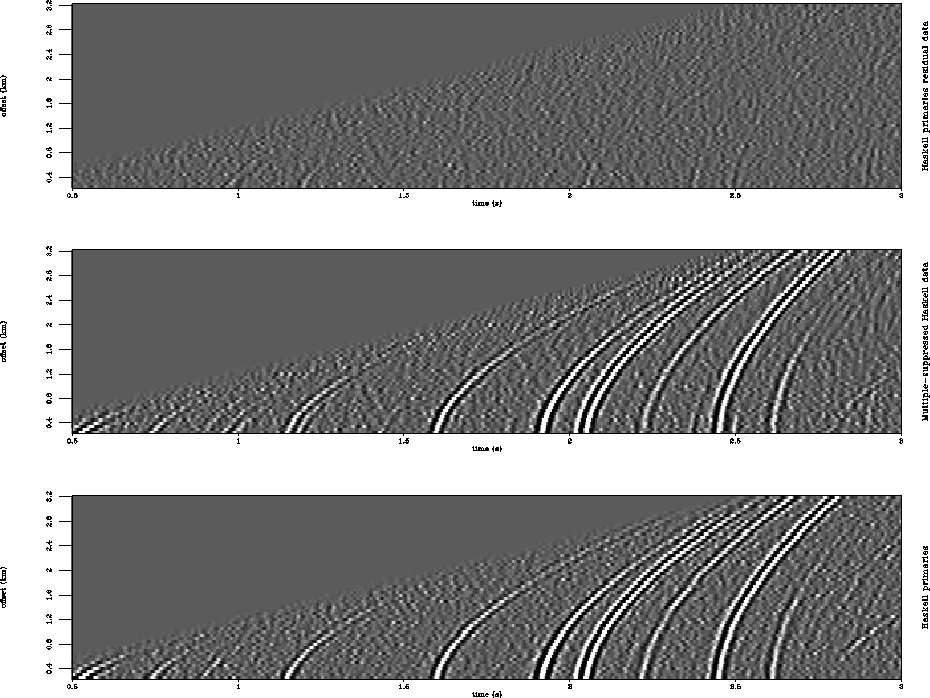
Figure ![[*]](http://sepwww.stanford.edu/latex2html/cross_ref_motif.gif) shows a tough test of the method that is not available
in field data situations. The left panel is the full waveform data
modeled without free-surface multiples, the center panel is
the multiple-suppressed data of Figure
shows a tough test of the method that is not available
in field data situations. The left panel is the full waveform data
modeled without free-surface multiples, the center panel is
the multiple-suppressed data of Figure ![[*]](http://sepwww.stanford.edu/latex2html/cross_ref_motif.gif) , and the right
panel is the unweighted subtraction of the two to make the residual data,
all plotted at the same scale.
Any amplitude error in the multiple-suppressed data in the offset or time
direction will cause reflection events to appear in the residual data.
However, the residual data is comprised mostly of incoherent noise.
There are faint traces of residual multiple reflection events at the very
near offsets, and some residual shear-converted energy that occurs at
moveout velocities lower than what was modeled in the L2 velocity scans.
This is our best evidence that the method appears to perform very well at
removing multiple reflections while simultaneously preserving AVO amplitudes.
, and the right
panel is the unweighted subtraction of the two to make the residual data,
all plotted at the same scale.
Any amplitude error in the multiple-suppressed data in the offset or time
direction will cause reflection events to appear in the residual data.
However, the residual data is comprised mostly of incoherent noise.
There are faint traces of residual multiple reflection events at the very
near offsets, and some residual shear-converted energy that occurs at
moveout velocities lower than what was modeled in the L2 velocity scans.
This is our best evidence that the method appears to perform very well at
removing multiple reflections while simultaneously preserving AVO amplitudes.
 |
 |
![[*]](http://sepwww.stanford.edu/latex2html/movie.gif)
 |
![[*]](http://sepwww.stanford.edu/latex2html/movie.gif)
 |
![[*]](http://sepwww.stanford.edu/latex2html/movie.gif)
 |
![[*]](http://sepwww.stanford.edu/latex2html/movie.gif)
 |
![[*]](http://sepwww.stanford.edu/latex2html/movie.gif)
Field data
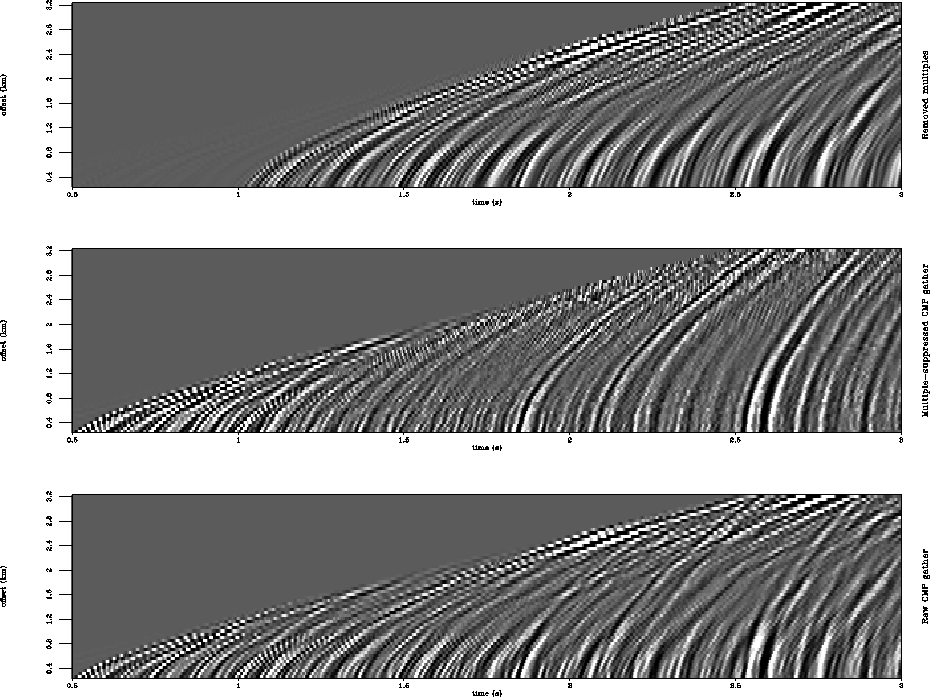
Figure ![[*]](http://sepwww.stanford.edu/latex2html/cross_ref_motif.gif) shows an application of our method to a single
CMP gather from the Mobil data set. The left panel shows the input data
in which multiple reflections mask the primary target events at 2.1 and
2.6 seconds. The center panel shows our multiple-suppressed estimate,
and the right panel shows the subtracted multiples. The three
prominent events at 1.8, 2.1 and 2.6 seconds have been cleaned up
in the multiple-suppressed version. Also, the top reservoir
reflection at 2.1 seconds has the expected amplitude-increasing-with-offset
AVO behavior, and the lower target at 2.6 seconds has the expected
opposite amplitude-decreasing-with-offset AVO trend, as predicted
by full waveform modeling from the well logs.
shows an application of our method to a single
CMP gather from the Mobil data set. The left panel shows the input data
in which multiple reflections mask the primary target events at 2.1 and
2.6 seconds. The center panel shows our multiple-suppressed estimate,
and the right panel shows the subtracted multiples. The three
prominent events at 1.8, 2.1 and 2.6 seconds have been cleaned up
in the multiple-suppressed version. Also, the top reservoir
reflection at 2.1 seconds has the expected amplitude-increasing-with-offset
AVO behavior, and the lower target at 2.6 seconds has the expected
opposite amplitude-decreasing-with-offset AVO trend, as predicted
by full waveform modeling from the well logs.
Another point of interest is that the raw input gather has a radial birefringence pattern that is typical of water-column multiples: amplitudes are brighter at the near and far offsets, yet weak in the middle offsets. The x-t radial periodicity of this effect is controlled by the water depth and the source bandwidth. The estimated multiple reflections in the right panel exhibit this radial birefringence pattern, but that the multiple-suppressed primaries in the center panel do not.
For comparative purposes,
Figures ![[*]](http://sepwww.stanford.edu/latex2html/cross_ref_motif.gif) and
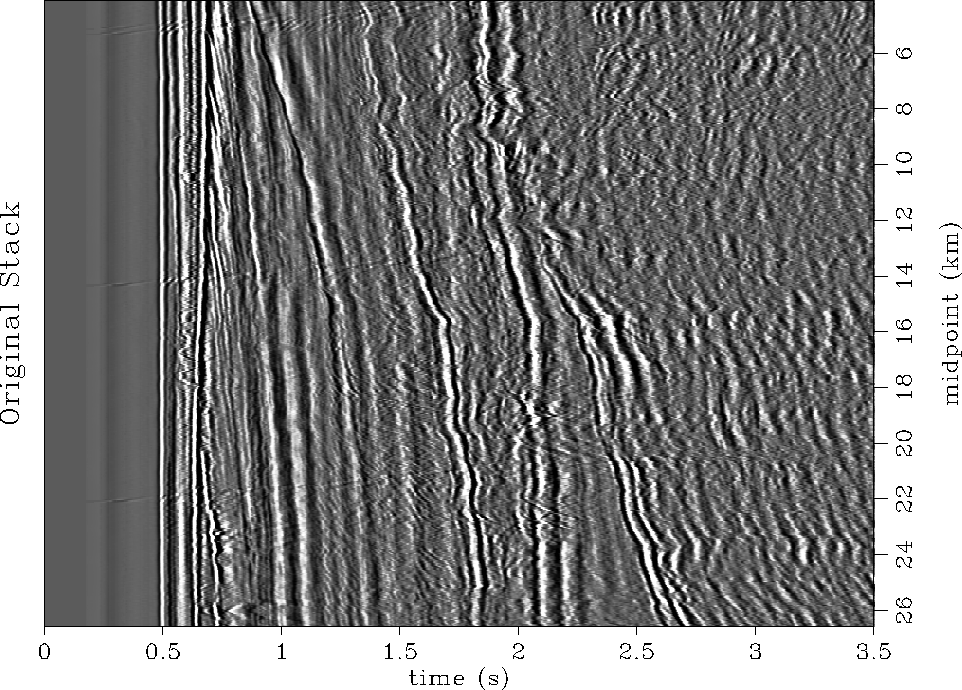
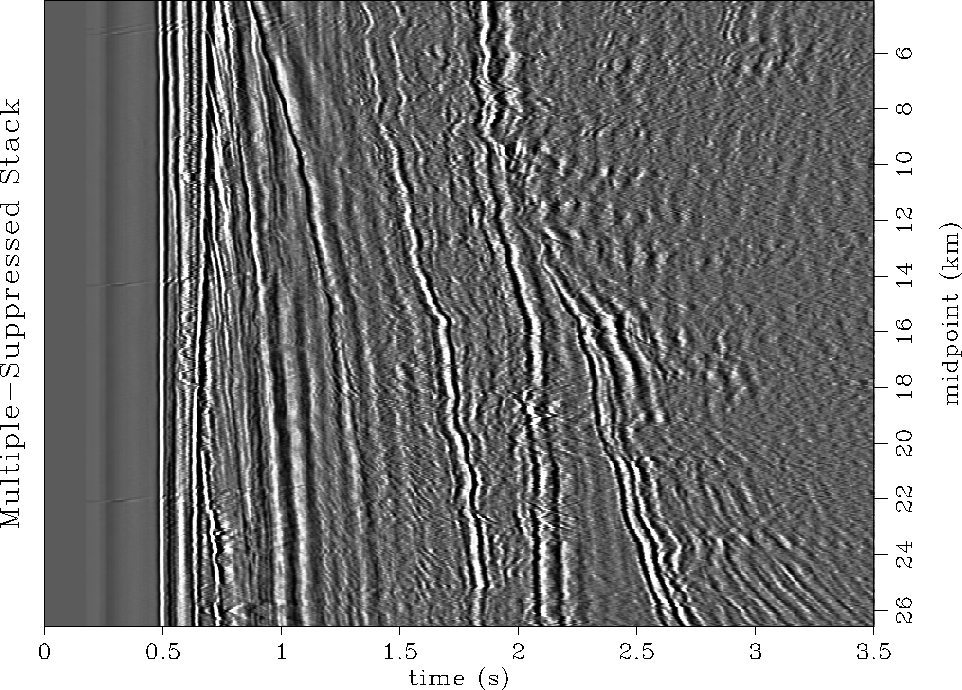
and ![[*]](http://sepwww.stanford.edu/latex2html/cross_ref_motif.gif) show stacked sections
of the Mobil data made before and after multiple-suppression
respectively. As is often the case, stacking is such a
powerful noise-suppression method that it tends to attenuate
multiples sufficiently well in stacked sections.
However, the multiple-suppression has definitely cleaned up deeper parts of the
section, especially in the region of horst-graben faulting at 2.5-3.5 seconds
and midpoints 20-26 km. A stacked section comparison
is mainly kinematic and gives little indication of dynamic AVO amplitude
preservation in the multiple suppression, as will be demonstrated
in the subsequent AVO analysis and migration/inversion sections.
show stacked sections
of the Mobil data made before and after multiple-suppression
respectively. As is often the case, stacking is such a
powerful noise-suppression method that it tends to attenuate
multiples sufficiently well in stacked sections.
However, the multiple-suppression has definitely cleaned up deeper parts of the
section, especially in the region of horst-graben faulting at 2.5-3.5 seconds
and midpoints 20-26 km. A stacked section comparison
is mainly kinematic and gives little indication of dynamic AVO amplitude
preservation in the multiple suppression, as will be demonstrated
in the subsequent AVO analysis and migration/inversion sections.
In summary, our multiple-suppressed gathers clearly show recovered primary reflection events with reasonable AVO behavior, and the estimated multiple reflections show radial birefringence patterns characteristic of water-column pegleg multiples. The stacked sections show that the multiple suppression has cleaned up deeper parts of the structure associated with horst-graben faulting. This combined evidence suggests that our multiple-suppression method works well on both synthetic and field data.
UNMIGRATED AVO ANALYSIS
Lumley and Ecker present their results of conventional unmigrated AVO analysis applied to the Mobil data. AVO gathers were examined before and after multiple suppression. Hydrocarbon indicator (HCI) sections were computed using near and far offset AVO amplitudes to try and highlight the top reservoir reflection in both cases. The multiple-suppressed AVO analysis gives a cleaner HCI section, and indicates a possible undrilled reservoir in the center graben block.
Unmigrated AVO gathers
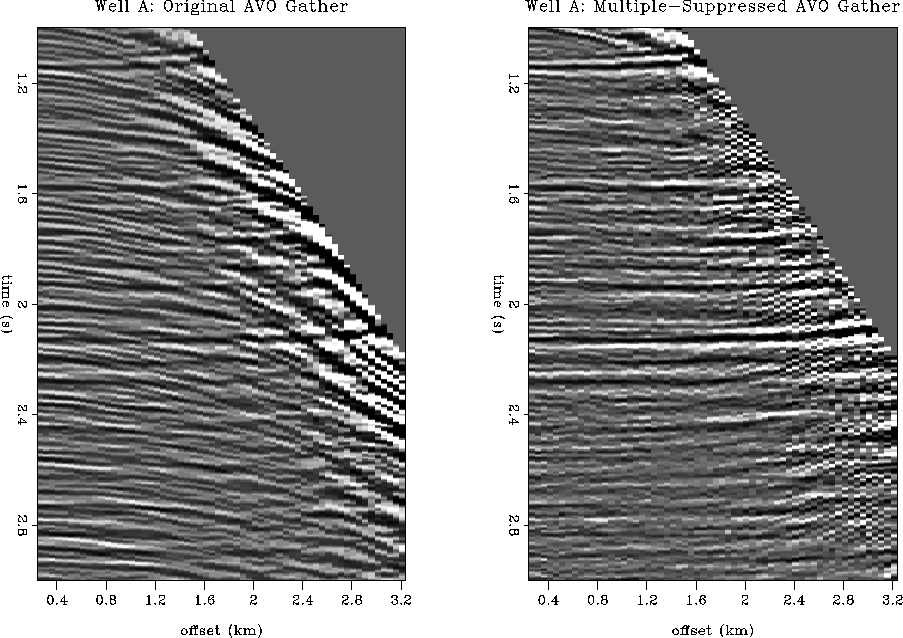
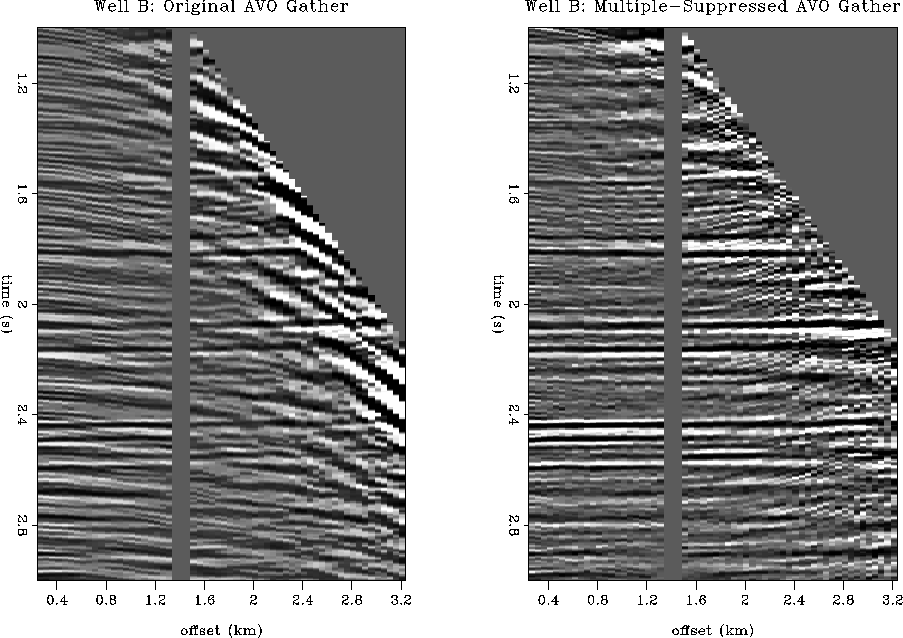
Figure ![[*]](http://sepwww.stanford.edu/latex2html/cross_ref_motif.gif) shows amplitude-corrected unmigrated AVO gathers
near the Well A location, and Figure
shows amplitude-corrected unmigrated AVO gathers
near the Well A location, and Figure ![[*]](http://sepwww.stanford.edu/latex2html/cross_ref_motif.gif) shows the same near
the Well B location, before and after multiple suppression.
Two iterations of stacking velocity analysis were performed:
one before and one after multiple suppression.
All multiple-suppressed gathers are NMO-corrected with the better
velocities obtained in the second iteration, whereas original
gathers with multiples are NMO-corrected with the inferior
first velocity analysis estimates. All gathers were amplitude-corrected
for the effects of geometric spreading and source-receiver directivity.
shows the same near
the Well B location, before and after multiple suppression.
Two iterations of stacking velocity analysis were performed:
one before and one after multiple suppression.
All multiple-suppressed gathers are NMO-corrected with the better
velocities obtained in the second iteration, whereas original
gathers with multiples are NMO-corrected with the inferior
first velocity analysis estimates. All gathers were amplitude-corrected
for the effects of geometric spreading and source-receiver directivity.
The left panel of Figures ![[*]](http://sepwww.stanford.edu/latex2html/cross_ref_motif.gif) and
and ![[*]](http://sepwww.stanford.edu/latex2html/cross_ref_motif.gif) show the
unmigrated AVO gathers before multiple suppression. The right panels
show the same after multiple-suppression. The source-receiver
directivity correction has unreasonably gained up far offset
multiple reflection amplitudes. That is because the multiples are
propagating more vertically than the primaries at the far offsets,
and so get overcompensated for wide-angle source-receiver directivity
and geometric spreading.
The two figures show that the multiple-suppressed gathers show cleaner
primary reflection events, reasonable AVO amplitudes, and better moveout
velocity correction; all of which should enhance AVO analysis.
show the
unmigrated AVO gathers before multiple suppression. The right panels
show the same after multiple-suppression. The source-receiver
directivity correction has unreasonably gained up far offset
multiple reflection amplitudes. That is because the multiples are
propagating more vertically than the primaries at the far offsets,
and so get overcompensated for wide-angle source-receiver directivity
and geometric spreading.
The two figures show that the multiple-suppressed gathers show cleaner
primary reflection events, reasonable AVO amplitudes, and better moveout
velocity correction; all of which should enhance AVO analysis.
 |
 |
Unmigrated HCI sections
HCI sections were computed using all full-fold CMP gathers along the line. Estimates of conventional (A,B) and relative-impedance-contrast parameter sections were obtained from the unmigrated AVO gathers. These showed reasonable-looking AVO structure, but did not show clean composite multi-parameter hydrocarbon indicators at the known top reservoir location.
Instead, a better HCI section was obtained as follows. The amplitude-corrected gathers were partially stacked into two reflection-angle ranges: 0-15 degrees, and all angles beyond. Call these two parameter sections ``near'' N and ``far'' F. A reasonable HCI section was then obtained using the composite indicator
| |
(11) |
This N,F technique does not contain as much AVO information as A,B or impedance-contrast sections, but has a higher S/N ratio. Amoco has given some presentations using a similar technique in recent off-the-record workshops. Our indicator is appropriate for the top reservoir in which amplitude increases with offset. We did not attempt to refine a separate indicator which would highlight the more subtle amplitude-decreasing-with-offset AVO anomaly at the deeper reservoir target.
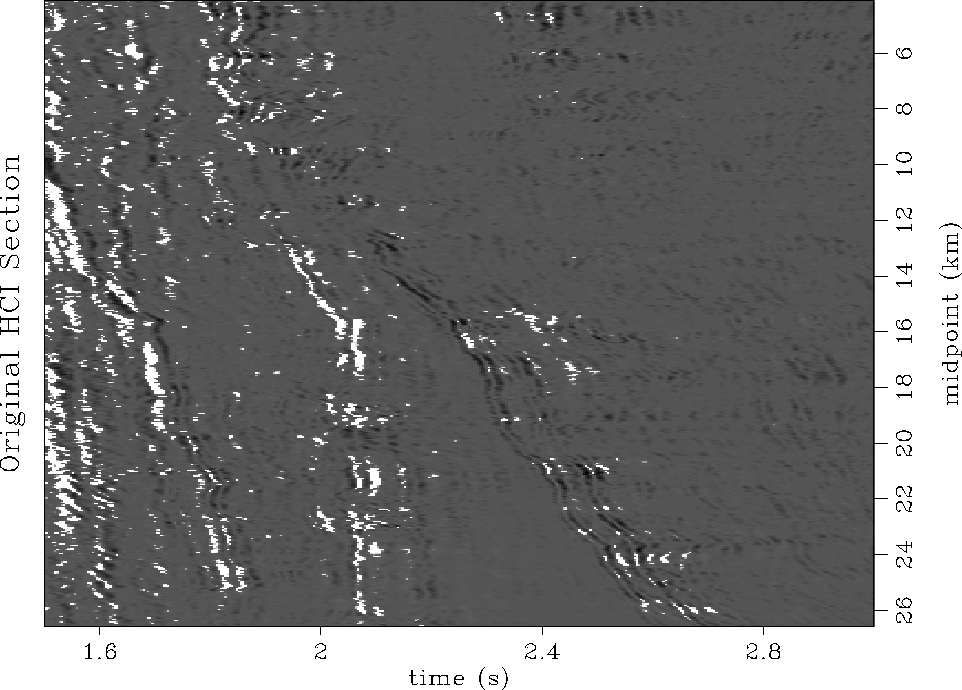
Figure ![[*]](http://sepwww.stanford.edu/latex2html/cross_ref_motif.gif) shows the HCI section computed as described above
for the non-multiple-suppressed data. White (red) indicates an HCI anomaly
of classic amplitude increasing with offset, which is appropriate
for the top reservoir. The HCI section is extremely noisy.
The top reservoir event shows up as anomalous along most of the line,
but unfortunately most shallower events give false anomalies too.
This HCI section would be practically useless to an interpreter trying
to high-grade a drilling location.
shows the HCI section computed as described above
for the non-multiple-suppressed data. White (red) indicates an HCI anomaly
of classic amplitude increasing with offset, which is appropriate
for the top reservoir. The HCI section is extremely noisy.
The top reservoir event shows up as anomalous along most of the line,
but unfortunately most shallower events give false anomalies too.
This HCI section would be practically useless to an interpreter trying
to high-grade a drilling location.
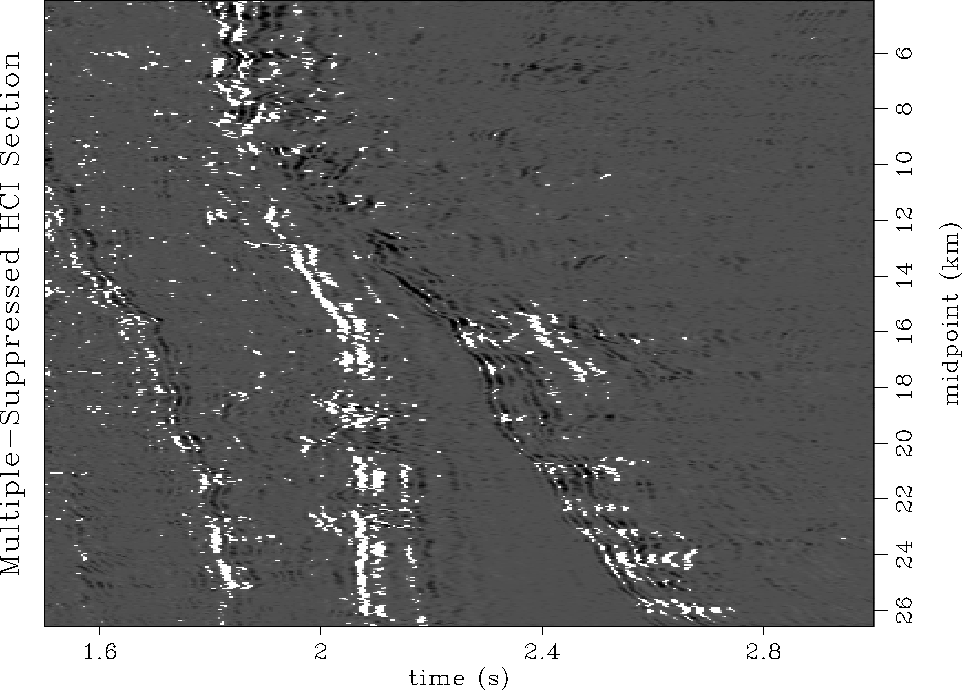
Figure ![[*]](http://sepwww.stanford.edu/latex2html/cross_ref_motif.gif) shows the same HCI section except computed using
the multiple-suppressed data. The section has been cleaned up
considerably compared to Figure
shows the same HCI section except computed using
the multiple-suppressed data. The section has been cleaned up
considerably compared to Figure ![[*]](http://sepwww.stanford.edu/latex2html/cross_ref_motif.gif) . The shallow event at
1.6-2.0 seconds is still noisy, but the HCI anomaly at the
2.1 second reservoir reflection is clearly stronger in S/N ratio.
A strong anomaly is highlighted for the first time
at 2.5 seconds and 15-18 km midpoint distance. This anomaly
occurs in a central graben block along the line, and as shown in the
next section, its strength increases in the updip direction, and is
truncated by the updip horst-graben normal fault. This HCI section would
definitely be of more value to an interpreter in correlating existing
well information to an AVO HCI section, and in suggesting potential
new drilling locations.
. The shallow event at
1.6-2.0 seconds is still noisy, but the HCI anomaly at the
2.1 second reservoir reflection is clearly stronger in S/N ratio.
A strong anomaly is highlighted for the first time
at 2.5 seconds and 15-18 km midpoint distance. This anomaly
occurs in a central graben block along the line, and as shown in the
next section, its strength increases in the updip direction, and is
truncated by the updip horst-graben normal fault. This HCI section would
definitely be of more value to an interpreter in correlating existing
well information to an AVO HCI section, and in suggesting potential
new drilling locations.
 |
![[*]](http://sepwww.stanford.edu/latex2html/movie.gif)
 |
![[*]](http://sepwww.stanford.edu/latex2html/movie.gif)
PRESTACK MIGRATION/INVERSION
Migration/inversion method
Lumley presents his Kirchhoff prestack migration/inversion method applied to the multiple-suppressed Mobil data. This method is based on previous amplitude-preserved prestack depth migration and impedance inversion work, Lumley , and is related to works by Bleistein , Beydoun and Mendes , and recently Schleicher et al. .
The method can operate in either the prestack time or depth migration domains, and compensates internally for geometric spreading and source-receiver directivity in a wave-equation consistent manner. Estimates of both reflection angle and reflection amplitude are provided, and are combined as a function of offset and (pseudo)depth to give the total angle-dependent reflectivity estimate. Elastic and AVO parameter estimates can be obtained as a second step given the migration/inversion angle-dependent reflectivity estimates as input.
For the Mobil data application, we performed amplitude-preserved prestack time migrations of constant-offset sections. Time migration was favored over depth migration because of its speed and robustness in this laterally-smooth velocity field. Sixty input offset sections were prestack-migrated into ten output offset sections, in a pseudodepth window of 1-3 seconds vertical traveltime. The migration takes about the same CPU run time as a standard Kirchhoff prestack time migration, but uses three times the memory to store the multiple images necessary to calculate the amplitude-preserved reflectivity and reflection-angle estimates.
Migration/inversion results
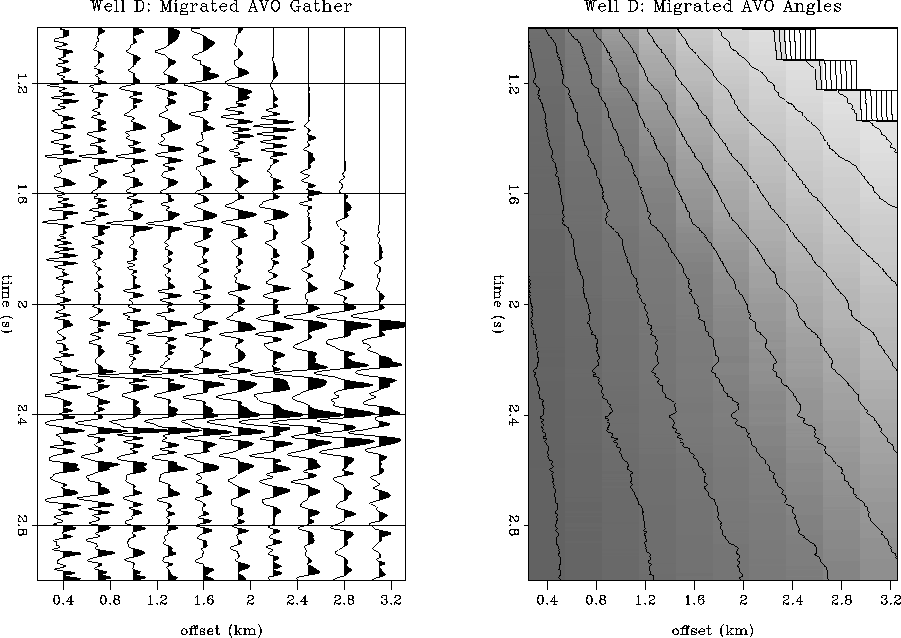
Figure ![[*]](http://sepwww.stanford.edu/latex2html/cross_ref_motif.gif) shows an example of a prestack migration/inversion
reflectivity (left) and reflection angle iso-x gather (right) located at
15.768 km midpoint distance, in the vicinity of the central graben.
An enlarged view of the reflection AVO response is shown in
Figure
shows an example of a prestack migration/inversion
reflectivity (left) and reflection angle iso-x gather (right) located at
15.768 km midpoint distance, in the vicinity of the central graben.
An enlarged view of the reflection AVO response is shown in
Figure ![[*]](http://sepwww.stanford.edu/latex2html/cross_ref_motif.gif) .
The top reservoir reflection at 2.05 seconds clearly exhibits
a classic AVO response of amplitude increasing with offset, as predicted
by the full waveform synthetic and the available well-log data.
The reflection at the major unconformity at 2.25 seconds
also has increasing AVO with offset, which may indicate hydrocarbon
content, or perhaps a large shear impedance decrease due to overpressure
across the unconformable boundary.
.
The top reservoir reflection at 2.05 seconds clearly exhibits
a classic AVO response of amplitude increasing with offset, as predicted
by the full waveform synthetic and the available well-log data.
The reflection at the major unconformity at 2.25 seconds
also has increasing AVO with offset, which may indicate hydrocarbon
content, or perhaps a large shear impedance decrease due to overpressure
across the unconformable boundary.
 |
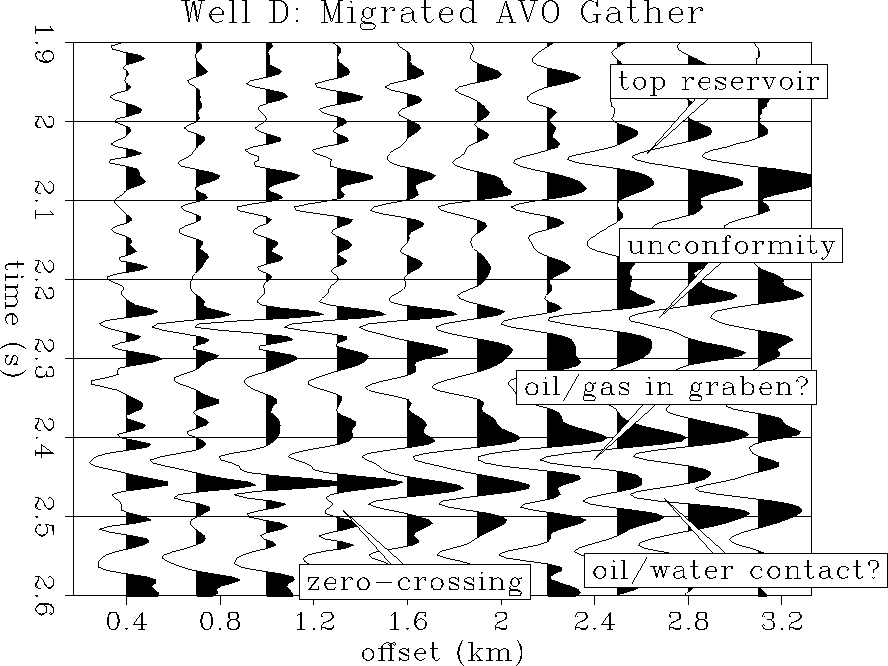
The large reflection at 2.45 seconds has a large increase in amplitude with
offset corresponding to the updip segment along the down-thrown graben, very
near to the updip horst-graben fault truncation as shown in Figures
![[*]](http://sepwww.stanford.edu/latex2html/cross_ref_motif.gif) and
and ![[*]](http://sepwww.stanford.edu/latex2html/cross_ref_motif.gif) . This classic AVO response
suggests that perhaps gas-charged hydrocarbons have accumulated updip in this
graben structure.
Just below this ``gas'' reflection, there is a reflection at 2.50 seconds,
best viewed in Figure
. This classic AVO response
suggests that perhaps gas-charged hydrocarbons have accumulated updip in this
graben structure.
Just below this ``gas'' reflection, there is a reflection at 2.50 seconds,
best viewed in Figure ![[*]](http://sepwww.stanford.edu/latex2html/cross_ref_motif.gif) ,
which seems to exhibit a polarity reversal. It starts off positive at
near offsets, has a zero crossing at about 1.3 km offset, and becomes
strongly negative at far offsets. This AVO behavior is consistent with
an oil-water contact, and may represent the base of the oil/gas zone
at this location. We have labeled this location as ``Well D''
for Mobil interpreters to consider as a future drilling prospect.
,
which seems to exhibit a polarity reversal. It starts off positive at
near offsets, has a zero crossing at about 1.3 km offset, and becomes
strongly negative at far offsets. This AVO behavior is consistent with
an oil-water contact, and may represent the base of the oil/gas zone
at this location. We have labeled this location as ``Well D''
for Mobil interpreters to consider as a future drilling prospect.
 |
Using the migrated AVO and angle gathers from the prestack
migration/inversion, an HCI section was computed in an analogous
manner to the description in the previous section.
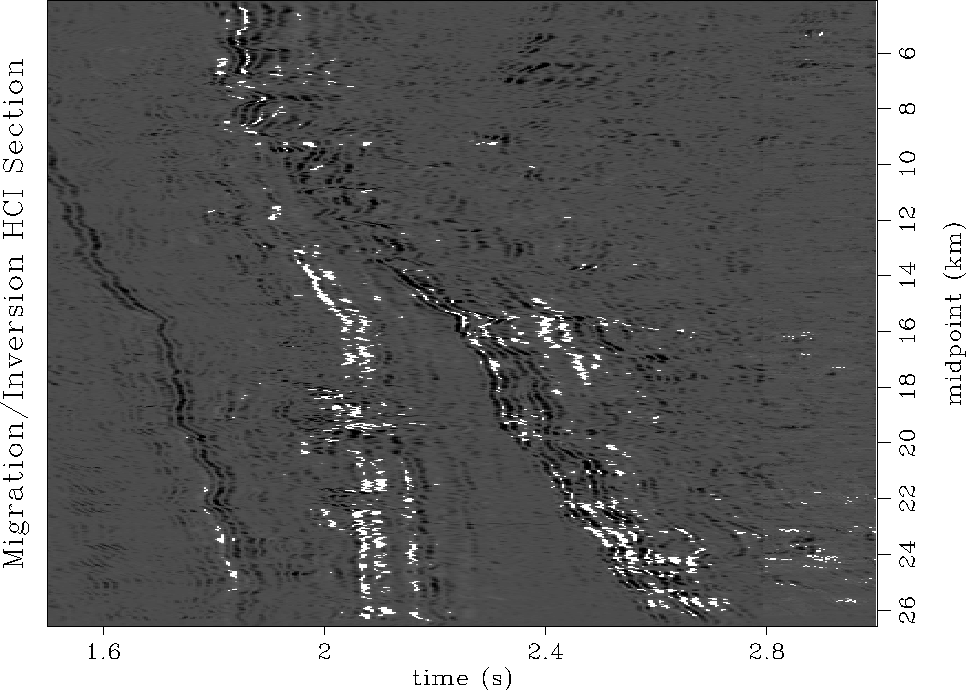
Figure ![[*]](http://sepwww.stanford.edu/latex2html/cross_ref_motif.gif) shows the migration/inversion HCI result.
The HCI section is much cleaner than the unmigrated
analysis of Figure
shows the migration/inversion HCI result.
The HCI section is much cleaner than the unmigrated
analysis of Figure ![[*]](http://sepwww.stanford.edu/latex2html/cross_ref_motif.gif) . The shallow event at 1.6-2.0 seconds
is now nearly completely devoid of a false hydrocarbon anomaly,
yet the top reservoir event at 2.1 seconds still correctly
shows a strong anomaly along the line.
. The shallow event at 1.6-2.0 seconds
is now nearly completely devoid of a false hydrocarbon anomaly,
yet the top reservoir event at 2.1 seconds still correctly
shows a strong anomaly along the line.
The deep AVO anomaly at 2.5 seconds in the center of the line is also
much stronger than the unmigrated AVO analysis shows, and the
truncation at the updip horst-graben fault is now clearly in focus.
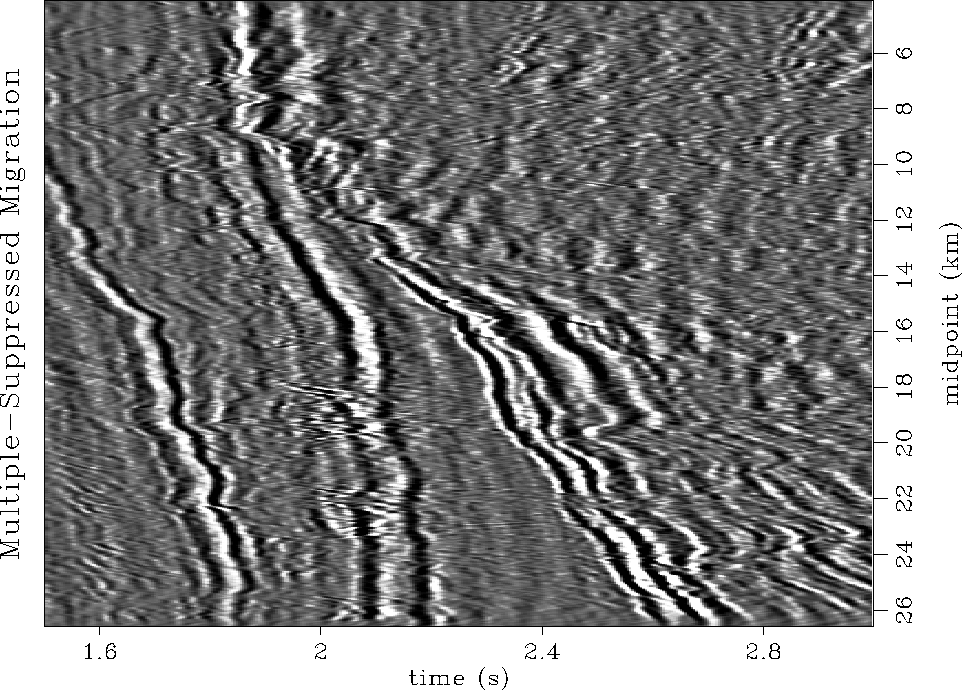
Figure ![[*]](http://sepwww.stanford.edu/latex2html/cross_ref_motif.gif) shows a stack of all the amplitude-preserved
prestack-migrated reflectivity gathers. Note the near-vertical
faulting at the right side of the section under the unconformity.
The down-thrown graben block in the center at 2.5 seconds from
15-20 km is now clearly visible, and the amplitude of the
dominant negative reflection seems to increase in brightness
in the updip direction. Both the amplitude-preserved migrated
section and the migration/inversion HCI section are consistent
with gas accumulated updip, trapped against the updip horst-graben
normal fault.
shows a stack of all the amplitude-preserved
prestack-migrated reflectivity gathers. Note the near-vertical
faulting at the right side of the section under the unconformity.
The down-thrown graben block in the center at 2.5 seconds from
15-20 km is now clearly visible, and the amplitude of the
dominant negative reflection seems to increase in brightness
in the updip direction. Both the amplitude-preserved migrated
section and the migration/inversion HCI section are consistent
with gas accumulated updip, trapped against the updip horst-graben
normal fault.
In this example, the combination of amplitude-preserved multiple-suppression and prestack migration/inversion seem to provide much better information needed to high-grade drilling locations than unmigrated AVO analysis or non-amplitude-preserved multiple attenuation.
 |
![[*]](http://sepwww.stanford.edu/latex2html/movie.gif)
 |
![[*]](http://sepwww.stanford.edu/latex2html/movie.gif)
CONCLUSION
We have focused on amplitude-preserved processing and analysis of the Mobil AVO data. We have shown that source-receiver consistent amplitude variations are as large as 10% and 20% respectively, and have demonstrated a quick and robust method for performing the required amplitude balancing corrections. Multiple reflections seriously contaminate primary AVO response in the Mobil data in CMP gather and HCI section comparisons. We developed a new method for suppressing undesirable multiple reflections while preserving AVO information along primary reflection events. The method is derived from least-squares conjugate-gradient inverse theory applied to time-variant Dix hyperbolic operators, and was shown to be effective on full waveform synthetics and the Mobil field data. Finally, we showed that prestack migration/inversion analysis is superior to unmigrated AVO analysis of the Mobil data. Our results correlate with a known reservoir reflection from well-log data, and we find what appears to be an as-yet undrilled hydrocarbon reservoir in a large central graben block underlaying the major structural unconformity.
We thank Stew Levin for his efforts in helping to organize our research seminar during his visit at SEP, for helping to unload, sort and preprocess the data, and for his many valuable suggestions during our brainstorming sessions. We also acknowledge valued seminar contributions from Bob Clapp and Yetmen Wang that helped illuminate problems related to the Mobil data, but do not appear explicitly in this paper. We commend Mobil Oil for releasing this AVO data set, and thank Bob Keys for traveling out to visit us and discuss the relevant issues. Thorbjørn Rekdal's postdoctorate at SEP was partially funded by Norsk Hydro and the Norwegian Research Council.
[local,SEGCON,GEOPHYSICS,GEOTLE,MISC,SEGBKS]
![[*]](http://sepwww.stanford.edu/latex2html/prev_gr.gif)