

Next: USE OF MODEL WEIGHTING
Up: Nichols: Dealiasing band limited
Previous: LEAST SQUARES INVERSE SLANT
This scheme can handle bandlimited data as long as the bandwidth is
broad enough for the spectrum to be continuous over the length of
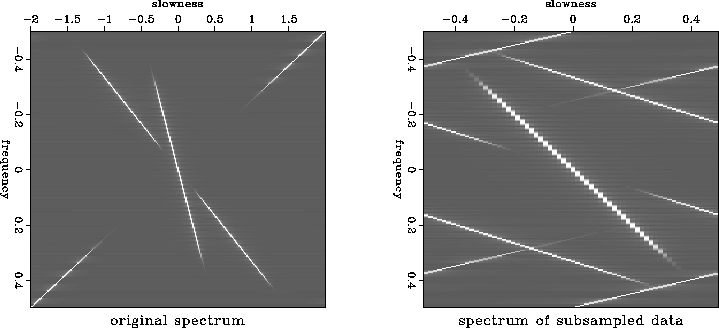
``continuity detection'' operator. Figure ![[*]](http://sepwww.stanford.edu/latex2html/cross_ref_motif.gif) shows the
f-k amplitude spectrum of three dipping events. The steepest event
occurs only at high frequencies, the flattest event occurs only at low
frequencies and the intermediate event occurs at medium frequencies.
The original spectrum is on the left and the spectrum of the data
after subsampling by a factor of four is on the right.
The data is severely aliased and the highest dip occurs only as
an aliased event
shows the
f-k amplitude spectrum of three dipping events. The steepest event
occurs only at high frequencies, the flattest event occurs only at low
frequencies and the intermediate event occurs at medium frequencies.
The original spectrum is on the left and the spectrum of the data
after subsampling by a factor of four is on the right.
The data is severely aliased and the highest dip occurs only as
an aliased event
three-fk
Figure 7 f-k spectrum of the data, original data on the left, data at four times the sampling interval on the right. The steepest dip occurs only as an aliased event.


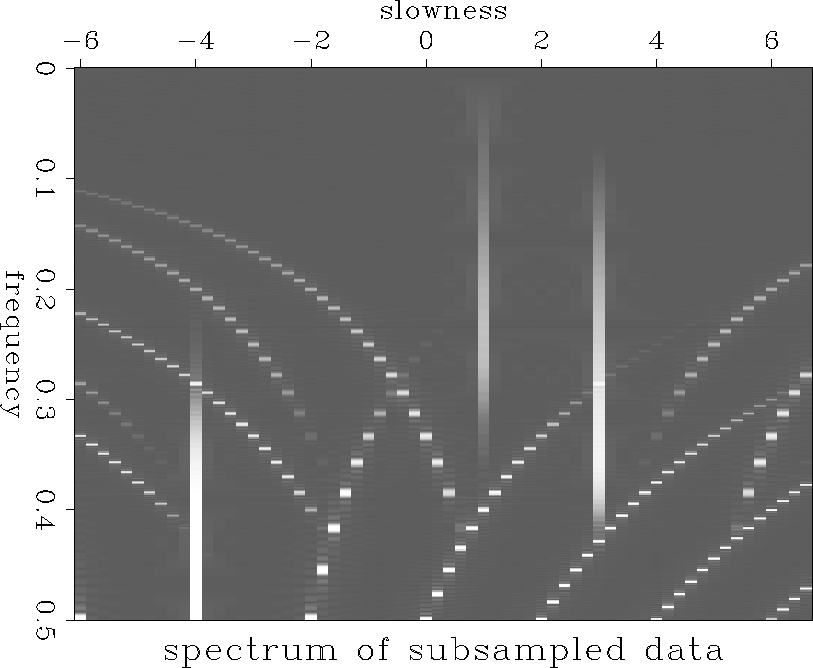
The  domain amplitude spectrum of the subsampled data is shown in
figure
 ![[*]](http://sepwww.stanford.edu/latex2html/cross_ref_motif.gif) . The three events are clearly
seen as events with continuity along single slowness traces whereas
the aliased energy is not continuous in frequency.
. The three events are clearly
seen as events with continuity along single slowness traces whereas
the aliased energy is not continuous in frequency.
three-pw
Figure 8  spectrum of the
subsampled data. spectrum of the
subsampled data.
|
|  |


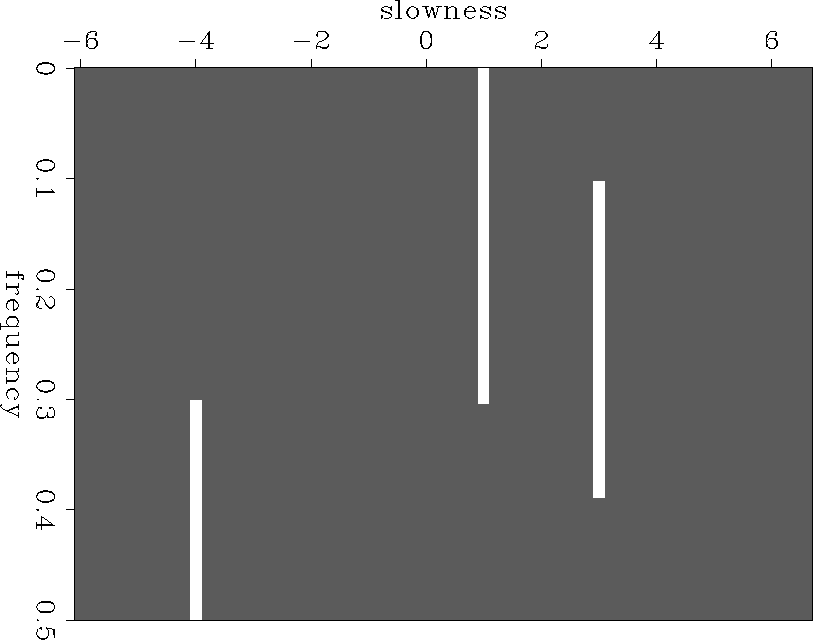
Figure ![[*]](http://sepwww.stanford.edu/latex2html/cross_ref_motif.gif) shows the mask function derived from this
spectrum. On this synthetic data the algorithm has worked excellently.
The mask is an exact fit to the areas containing unaliased data.
shows the mask function derived from this
spectrum. On this synthetic data the algorithm has worked excellently.
The mask is an exact fit to the areas containing unaliased data.
three-mask
Figure 9  The mask function derived from the spectrum shown in figure The mask function derived from the spectrum shown in figure ![[*]](http://sepwww.stanford.edu/latex2html/cross_ref_motif.gif) . .
|
|  |


The least squares inverse slant stack under the masking operator is
shown in figure ![[*]](http://sepwww.stanford.edu/latex2html/cross_ref_motif.gif) , the method has been very
successful, the slant stack only has significant energy in the
unaliased portions of the spectrum. Figure
, the method has been very
successful, the slant stack only has significant energy in the
unaliased portions of the spectrum. Figure ![[*]](http://sepwww.stanford.edu/latex2html/cross_ref_motif.gif) shows
the f-k spectrum of the interpolated data, reconstructed at one
quarter of the input trace spacing it is a perfect match to the
original f-k spectrum before interpolation, in figure
shows
the f-k spectrum of the interpolated data, reconstructed at one
quarter of the input trace spacing it is a perfect match to the
original f-k spectrum before interpolation, in figure ![[*]](http://sepwww.stanford.edu/latex2html/cross_ref_motif.gif) .
.
three-masklsq
Figure 10  spectrum of the least squares inverse slant stack using the masked operator. spectrum of the least squares inverse slant stack using the masked operator.
|
|  |


three-rec4fk
Figure 11 f-k spectrum of the data reconstructed at four times the input trace spacing. Compare this with figure ![[*]](http://sepwww.stanford.edu/latex2html/cross_ref_motif.gif)
|
|  |


Next: USE OF MODEL WEIGHTING
Up: Nichols: Dealiasing band limited
Previous: LEAST SQUARES INVERSE SLANT
Stanford Exploration Project
11/18/1997
![[*]](http://sepwww.stanford.edu/latex2html/cross_ref_motif.gif) shows the
f-k amplitude spectrum of three dipping events. The steepest event
occurs only at high frequencies, the flattest event occurs only at low
frequencies and the intermediate event occurs at medium frequencies.
The original spectrum is on the left and the spectrum of the data
after subsampling by a factor of four is on the right.
The data is severely aliased and the highest dip occurs only as
an aliased event
shows the
f-k amplitude spectrum of three dipping events. The steepest event
occurs only at high frequencies, the flattest event occurs only at low
frequencies and the intermediate event occurs at medium frequencies.
The original spectrum is on the left and the spectrum of the data
after subsampling by a factor of four is on the right.
The data is severely aliased and the highest dip occurs only as
an aliased event


