


The mapping from ![]() to x-t is a simple superposition of
linear events. Each sample in
to x-t is a simple superposition of
linear events. Each sample in ![]() becomes a line in x-t.
Figure
becomes a line in x-t.
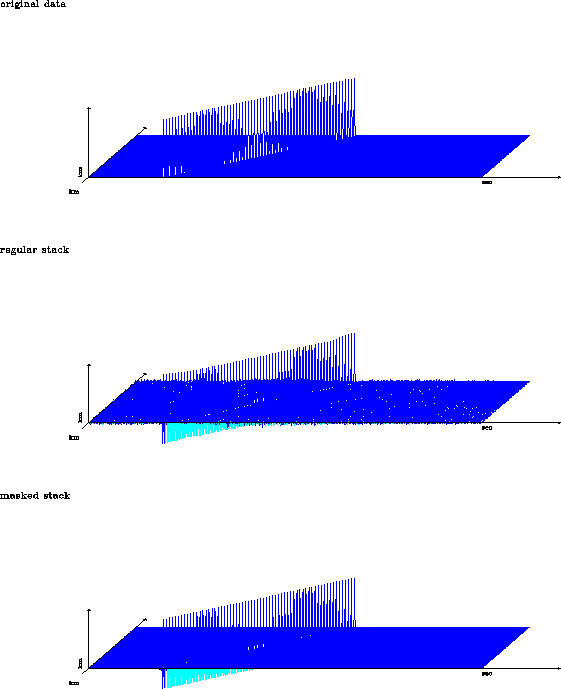
Figure ![[*]](http://sepwww.stanford.edu/latex2html/cross_ref_motif.gif) has three panels. The top panel is the
original data in x-t; it is a single dipping event. The amplitude is
constant along the event and there are no negative values in the data.
The middle panel shows the x-t data reconstructed from the aliased
has three panels. The top panel is the
original data in x-t; it is a single dipping event. The amplitude is
constant along the event and there are no negative values in the data.
The middle panel shows the x-t data reconstructed from the aliased
![]() data. The high frequency energy scattered over the plot is
the, mispositioned, aliased data. The bottom panel shows the x-t
data reconstructed from the slant stack data after application of the
anti-alias mask. The dispersed aliased data is removed but there are
still some artifacts. The frequency content of the original data has
not been correctly recovered. This is despite the fact that a ``rho''
filter was applied to correct for the high frequencies lost in the
slant stack transform. The rho filter is a correction derived under
the assumption that the data is continuous and has infinite aperture.
The artifacts result from the finite sampling and finite aperture of the
original x-t data.
data. The high frequency energy scattered over the plot is
the, mispositioned, aliased data. The bottom panel shows the x-t
data reconstructed from the slant stack data after application of the
anti-alias mask. The dispersed aliased data is removed but there are
still some artifacts. The frequency content of the original data has
not been correctly recovered. This is despite the fact that a ``rho''
filter was applied to correct for the high frequencies lost in the
slant stack transform. The rho filter is a correction derived under
the assumption that the data is continuous and has infinite aperture.
The artifacts result from the finite sampling and finite aperture of the
original x-t data.
 |


