

Next: SUMMARY
Up: DYNAMIC BEHAVIOR
Previous: The zero-offset waveform
As important as the relative response between different reflections is
the amplitude response of a single reflection as a function of the
offset, or the illumination angle. The two P-to-P reflections of the previous
subsection are separately analyzed here. To allow a direct comparison
with the analytical curve for the PP plane-wave reflection coefficient,
the wavefields simulated by each of the methods were mapped to
the tau-p domain, which corresponds to the plane-wave decomposition
of the original wavefields. Each figure used in this analysis contains
five curves. The two continuous curves correspond to the real and imaginary
parts of the theoretical P-to-P plane-wave response as a function
of the horizontal slowness. The theoretical response
includes the PP reflection coefficient and the two-way (angle-dependent)
PP transmission coefficient. The other three curves come from the
tau-p transform of the simulated wavefields, multiplied by a
scaling factor that normalizes the amplitudes of the fifteenth horizontal slowness to the theoretical amplitude.
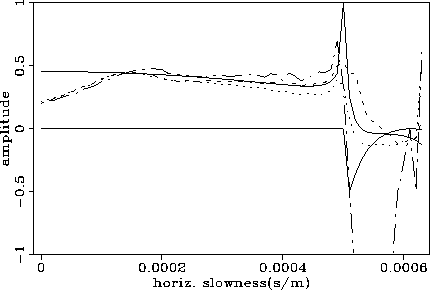
Figure ![[*]](http://sepwww.stanford.edu/latex2html/cross_ref_motif.gif) shows the curves associated with the water-bottom
reflection. In the low horizontal slowness region the dual-operator curve
(dashed-line) fits the theoretical curve almost perfectly, while the other
two curves also represent a good approximation to the theoretical curve.
It is also important to notice that the curve from the traditional
finite-difference modeling (dashed-dotted-line) oscillates more than the
other two curves. In the high horizontal slowness region, the traditional
finite-difference method completely fails to approximate the theoretical
curve while the other two methods still maintain a reasonably close fitting
of the theoretical curve. One reason for the larger misfit here is the strong
interference from the reflection of the second interface in the far offsets.
shows the curves associated with the water-bottom
reflection. In the low horizontal slowness region the dual-operator curve
(dashed-line) fits the theoretical curve almost perfectly, while the other
two curves also represent a good approximation to the theoretical curve.
It is also important to notice that the curve from the traditional
finite-difference modeling (dashed-dotted-line) oscillates more than the
other two curves. In the high horizontal slowness region, the traditional
finite-difference method completely fails to approximate the theoretical
curve while the other two methods still maintain a reasonably close fitting
of the theoretical curve. One reason for the larger misfit here is the strong
interference from the reflection of the second interface in the far offsets.
avoresp1
Figure 6 Amplitude versus horizontal slowness of the PP reflection from the
water-bottom interface. These curves were extracted from the plane-wave
decomposition of the wavefields generated by the three modeling schemes.
The thick continuous line and the thin continuous line correspond,
respectively, to the real and imaginary parts of the theoretical PP plane-wave
reflection coefficient; the dotted-line is the amplitude response from
the propagator-matrix scheme; the dashed-line is the amplitude response
from the dual-operator scheme; the thin dot-dashed-line comes from
the traditional finite-difference scheme.


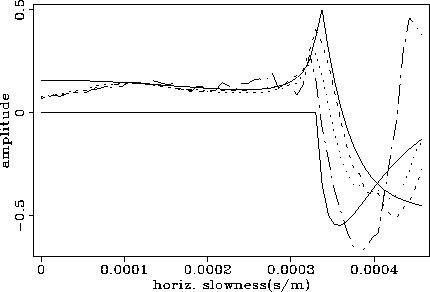
As in the previous case, the curves for the second PP primary reflection
(Figure ![[*]](http://sepwww.stanford.edu/latex2html/cross_ref_motif.gif) ) approximate well the theoretical curve for low values of
horizontal slowness. Again, the curve from the traditional finite-difference
scheme is much more jagged than the curves from the other two schemes.
For larger values of horizontal slowness, the dual-operator and the
propagator-matrix curves are closer to the theoretical curve than the
traditional finite-difference curve with better fit than in the
water bottom case, mainly because the interference from other events
is much weaker in this case.
Particularly impressive is the extremely good fit obtained by the
dual-operator method (dashed-line) for the whole range
) approximate well the theoretical curve for low values of
horizontal slowness. Again, the curve from the traditional finite-difference
scheme is much more jagged than the curves from the other two schemes.
For larger values of horizontal slowness, the dual-operator and the
propagator-matrix curves are closer to the theoretical curve than the
traditional finite-difference curve with better fit than in the
water bottom case, mainly because the interference from other events
is much weaker in this case.
Particularly impressive is the extremely good fit obtained by the
dual-operator method (dashed-line) for the whole range![[*]](http://sepwww.stanford.edu/latex2html/foot_motif.gif) of horizontal slownesses, including the almost perfect prediction of the
important zero-crossing point.
of horizontal slownesses, including the almost perfect prediction of the
important zero-crossing point.
avoresp2
Figure 7 Amplitude versus horizontal slowness of the PP reflection from the
interface between the second and third layer of the model. These curves were
extracted from the plane-wave decomposition of the wavefields generated by
the three modeling schemes. The thick continuous line and the thin
continuous line correspond, respectively, to the real and imaginary parts
of the theoretical PP plane-wave reflection coefficient; the
dotted-line is the amplitude response from the propagator-matrix scheme;
the dashed-line is the amplitude response from the dual-operator scheme;
the thin dot-dashed-line comes from the traditional finite-difference
scheme.


Next: SUMMARY
Up: DYNAMIC BEHAVIOR
Previous: The zero-offset waveform
Stanford Exploration Project
11/18/1997
![[*]](http://sepwww.stanford.edu/latex2html/cross_ref_motif.gif) shows the curves associated with the water-bottom
reflection. In the low horizontal slowness region the dual-operator curve
(dashed-line) fits the theoretical curve almost perfectly, while the other
two curves also represent a good approximation to the theoretical curve.
It is also important to notice that the curve from the traditional
finite-difference modeling (dashed-dotted-line) oscillates more than the
other two curves. In the high horizontal slowness region, the traditional
finite-difference method completely fails to approximate the theoretical
curve while the other two methods still maintain a reasonably close fitting
of the theoretical curve. One reason for the larger misfit here is the strong
interference from the reflection of the second interface in the far offsets.
shows the curves associated with the water-bottom
reflection. In the low horizontal slowness region the dual-operator curve
(dashed-line) fits the theoretical curve almost perfectly, while the other
two curves also represent a good approximation to the theoretical curve.
It is also important to notice that the curve from the traditional
finite-difference modeling (dashed-dotted-line) oscillates more than the
other two curves. In the high horizontal slowness region, the traditional
finite-difference method completely fails to approximate the theoretical
curve while the other two methods still maintain a reasonably close fitting
of the theoretical curve. One reason for the larger misfit here is the strong
interference from the reflection of the second interface in the far offsets.

![[*]](http://sepwww.stanford.edu/latex2html/foot_motif.gif)
