 |
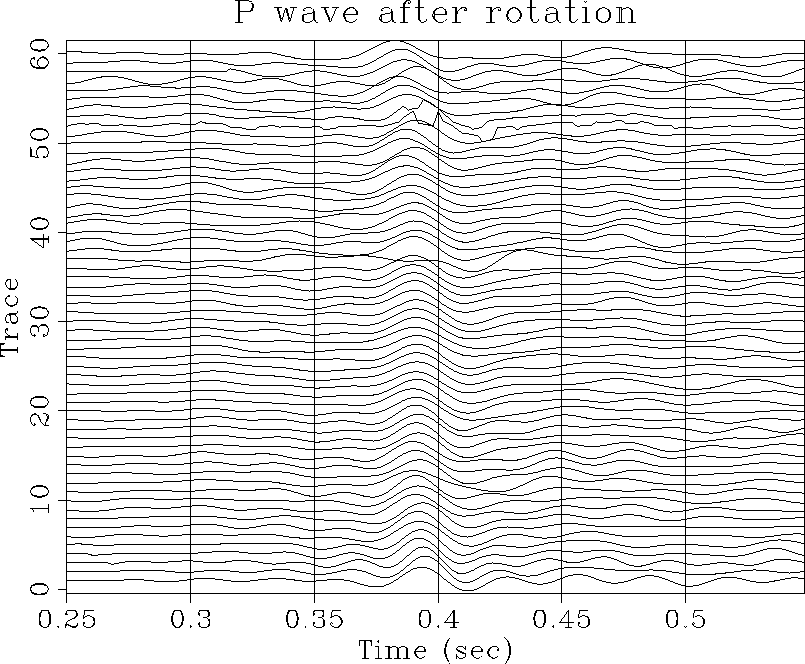
Figure 4 A small portion of the P wave section after rotation and NMO correction. The shape of the arrival is quite consistent.
Figure 4 is a wiggle-trace display of a small window of the P wave section after rotation (and NMO correction). Trace balancing has also been performed to emphasize variations in wavelet shape (rather than amplitude) from trace to trace. The window is centered around the P event. The wavelet shape is quite consistent, leading us to believe that we have done a good job of rotation, and that the wavelet produced by stacking will be meaningful.
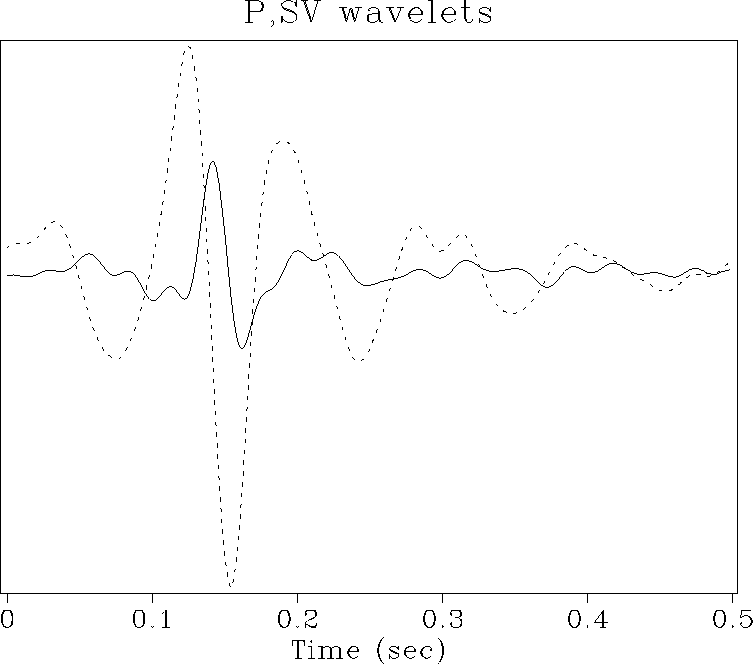
We repeated the entire processing sequence using a window of data containing the SV event. The picked arrival directions were very similar to the P case. Figure 5 shows the P and SV wavelets produced by stacking. These have been used by Leonid Vanyan (Vanyan, 1990) to deconvolve the data.
 |
 |