 |
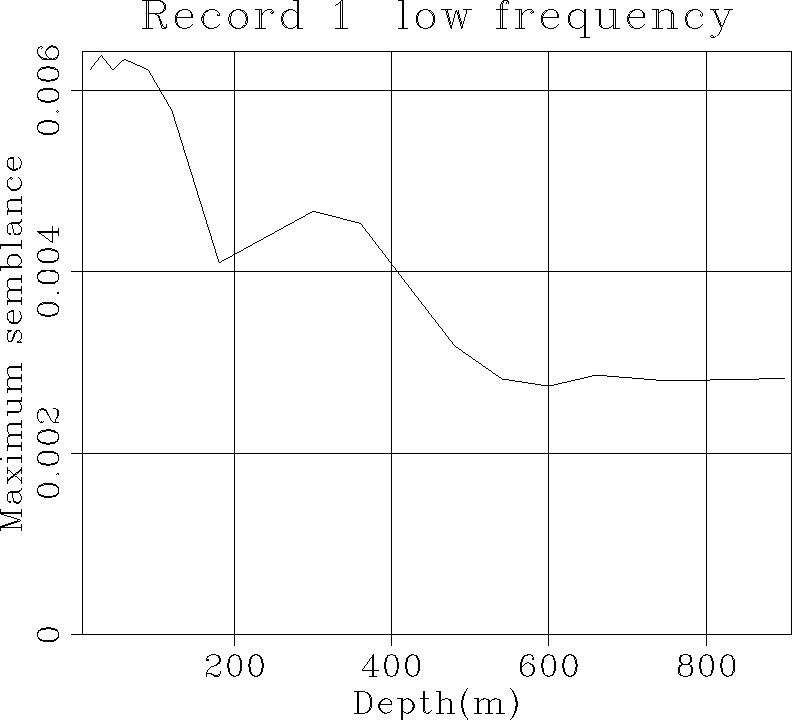
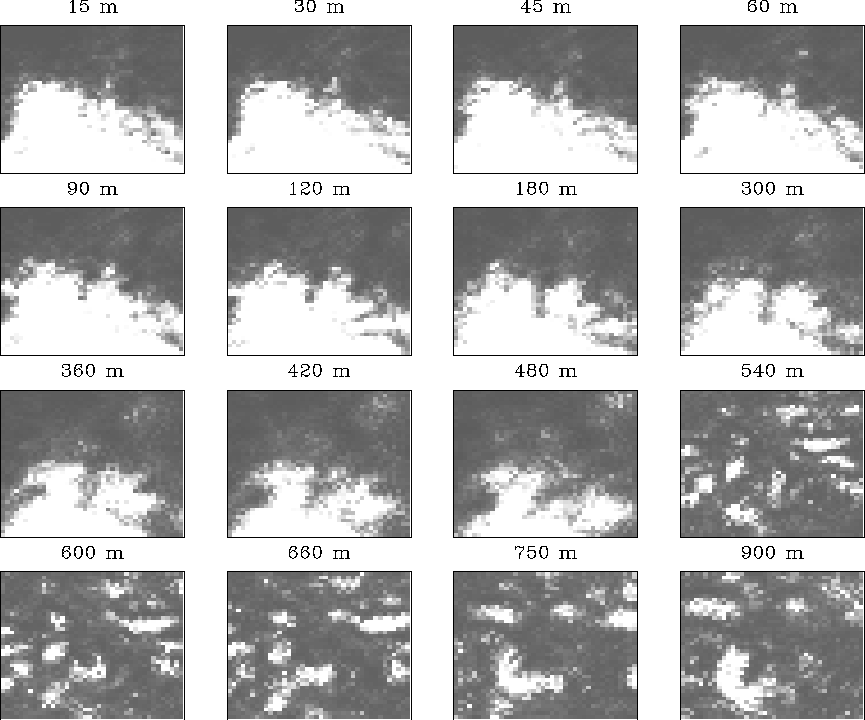
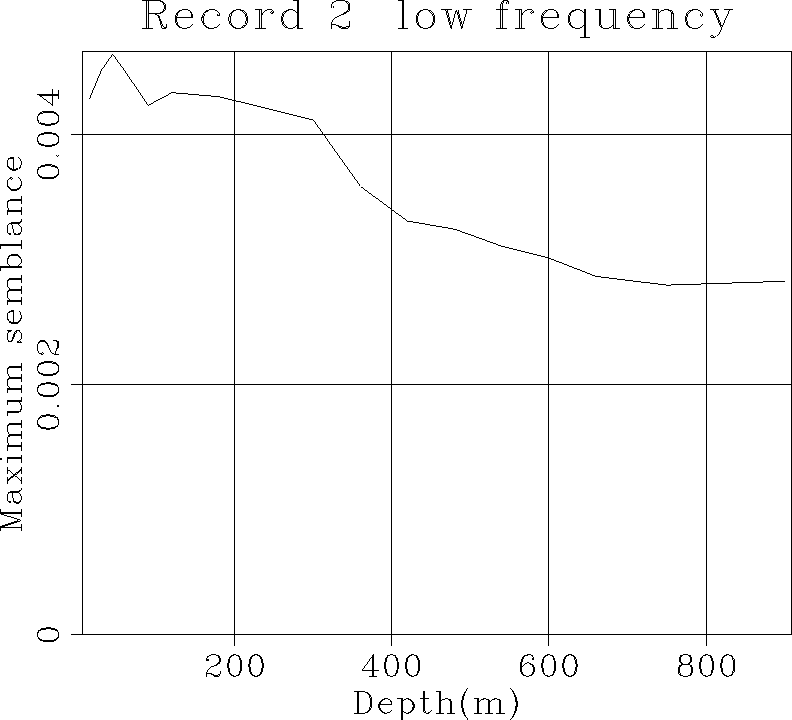
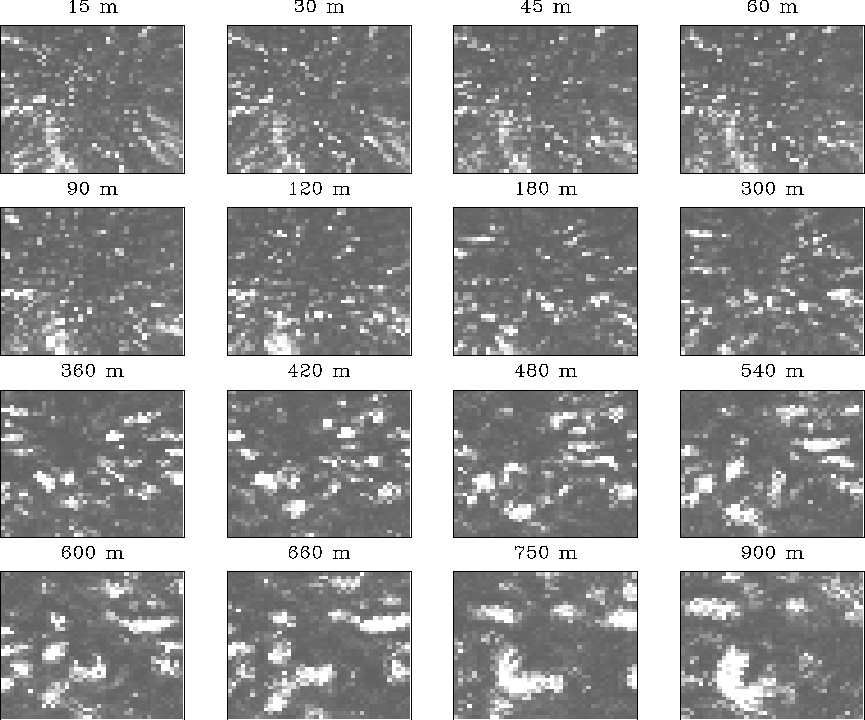
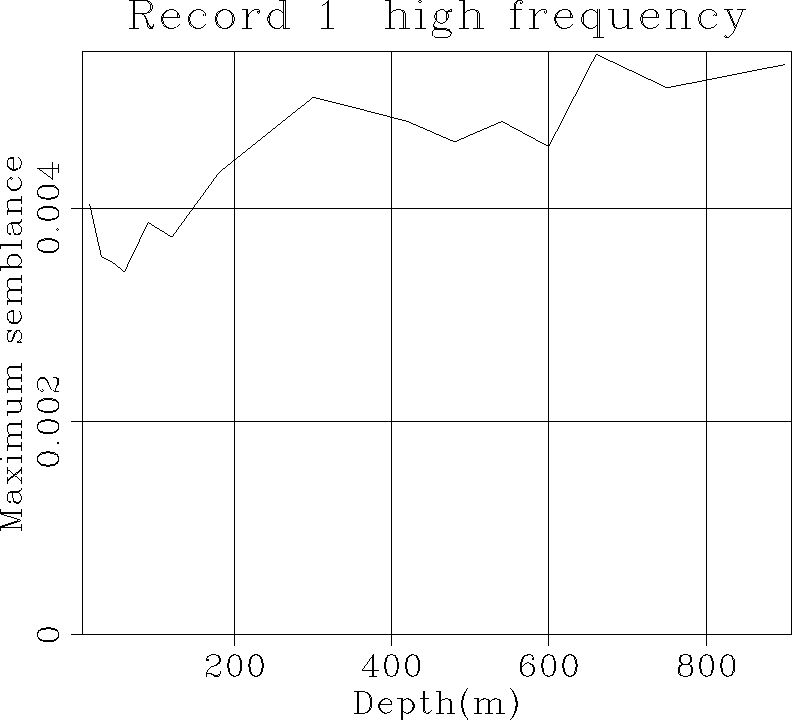
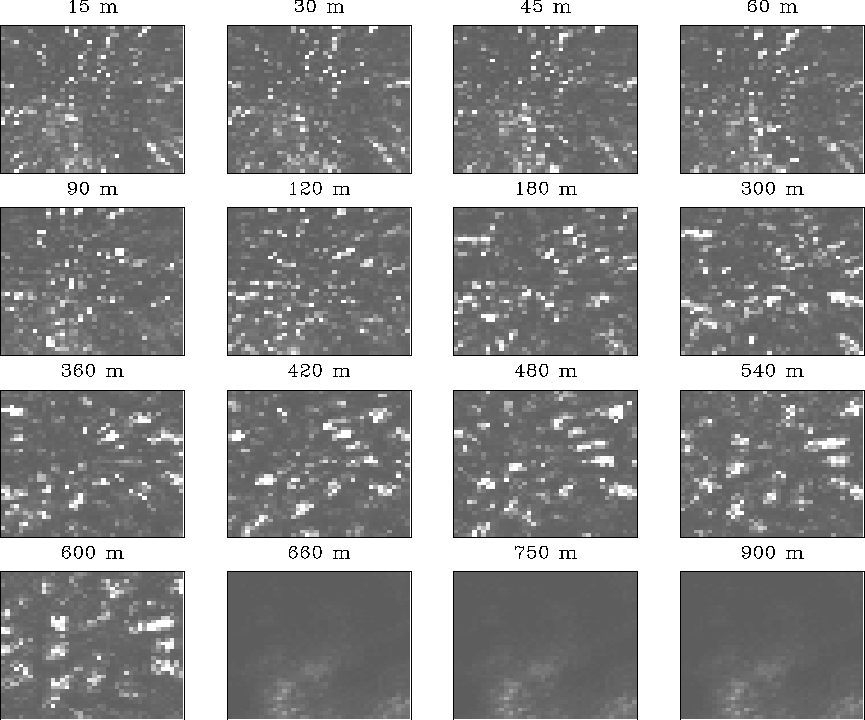
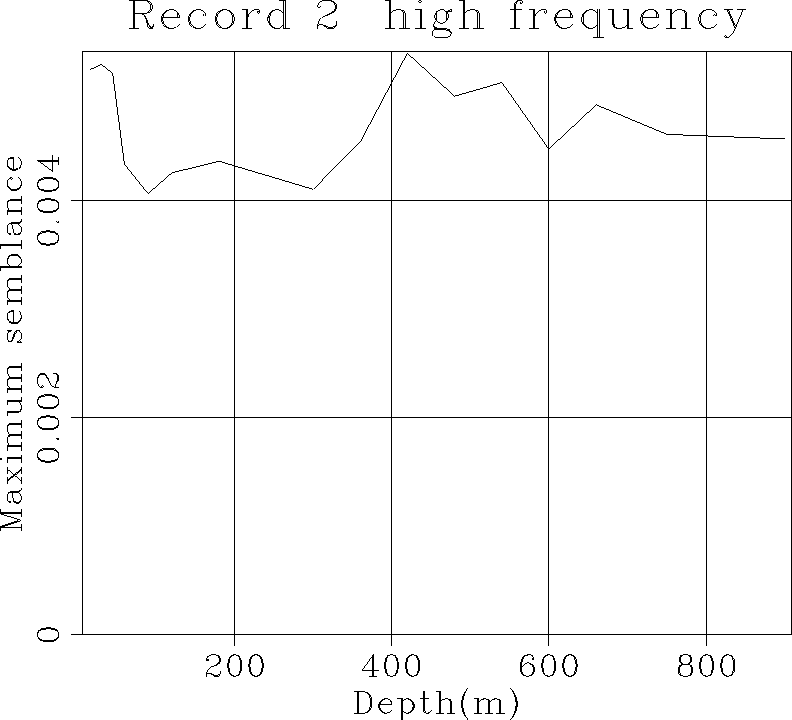
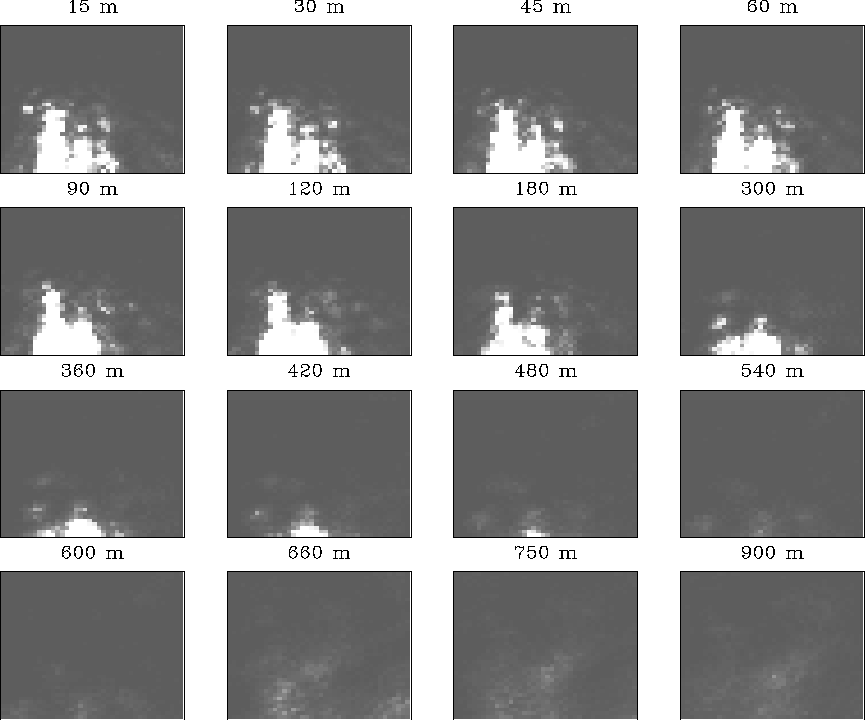
Figure 6 Semblance computed along moveout trajectories for possible source locations in 3-D. Each panel corresponds to a different depth. The limits of each picture are the boundaries of the array. Data in the low-frequency range (10-60 Hz) were used, and not surprisingly noise from pumps on the surface dominates the results.
