Next: Field data
Up: EXAMPLES
Previous: EXAMPLES
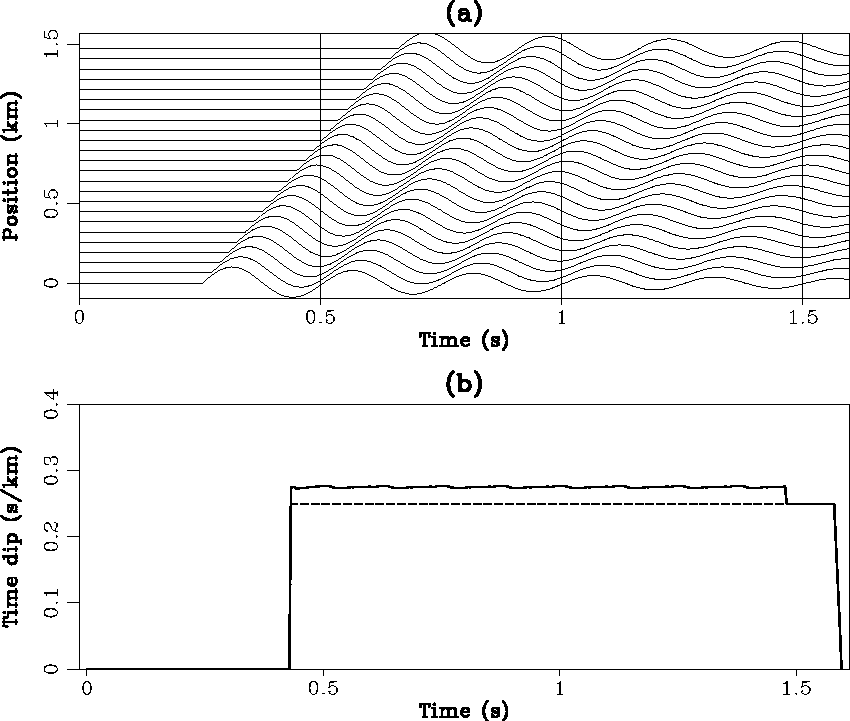
We begin with a simple synthetic section shown in Figure 2a.
The events on this section have a constant time-dip. The time-shift
corresponding to this dip is not an integer multiples of the time-sampling
interval  . We want to show that the non-linear optimization
gives an optimal time-shift that is the integer multiple of closest
to the true solution,
and that the linear optimization improves the solution to high accuracy.
From 2b, we see that these are indeed true.
The time-dip 0.275 gives a time-shift of
. We want to show that the non-linear optimization
gives an optimal time-shift that is the integer multiple of closest
to the true solution,
and that the linear optimization improves the solution to high accuracy.
From 2b, we see that these are indeed true.
The time-dip 0.275 gives a time-shift of  per
per  .The solution of the non-linear optimization is
  . The overall
solution is around
. The overall
solution is around  .
linepick
.
linepick
Figure 2 Accuracy of the picking algorithm:
(a) plane waves with a constant time-dip equal to 0.275; (b) the
dash-line shows the picked time-dip at a fixed horizontal location by
nonlinear optimization, and the solid line shows the final result of the
algorithm.

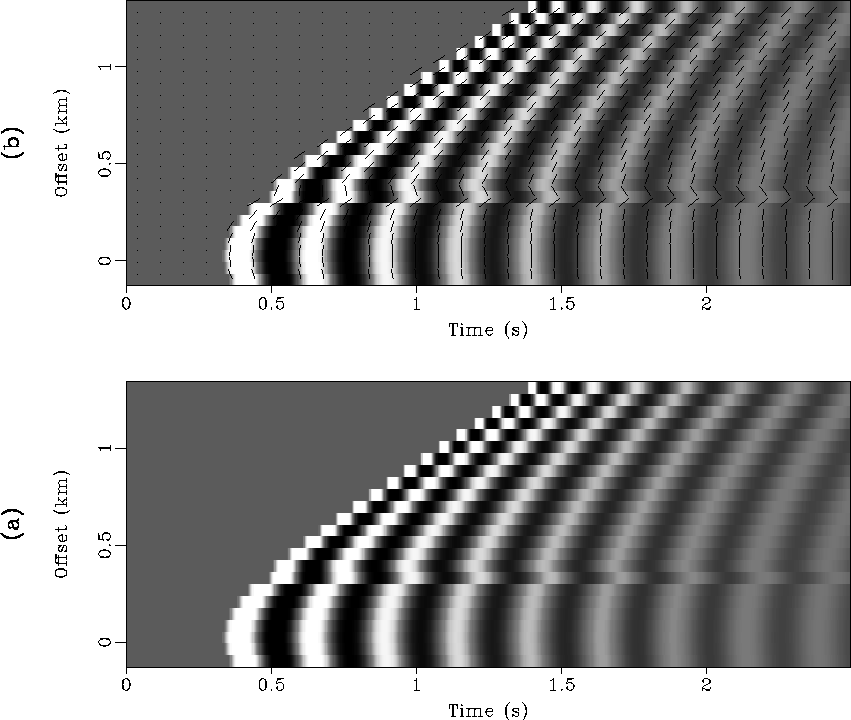
Data in the second example is shown in Figure 3a.
It was first generated by Claerbout (1990) to test the plane wave destructor
operator. At far offsets, data suffers from spatial aliasing.
A trace at the offset of 3.5 km is shifted on purpose. In this example,
we want to confirm two results: (1)our algorithm can handle data aliased
spatially; (2) the spatial resolution of our algorithm is approximately
equal to the spatial-sampling interval of data. Figure 3b
shows the result of dip-picking. In this figure, we use short line-segments to
represent local dips and overlay them on data. We see the line segments
follow the dips of events everywhere.
This result is superior to that of the plane wave destructor method.
The algorithm also picks correctly the steep dips caused by the shifted trace,
which proves the high resolution of the algorithm.
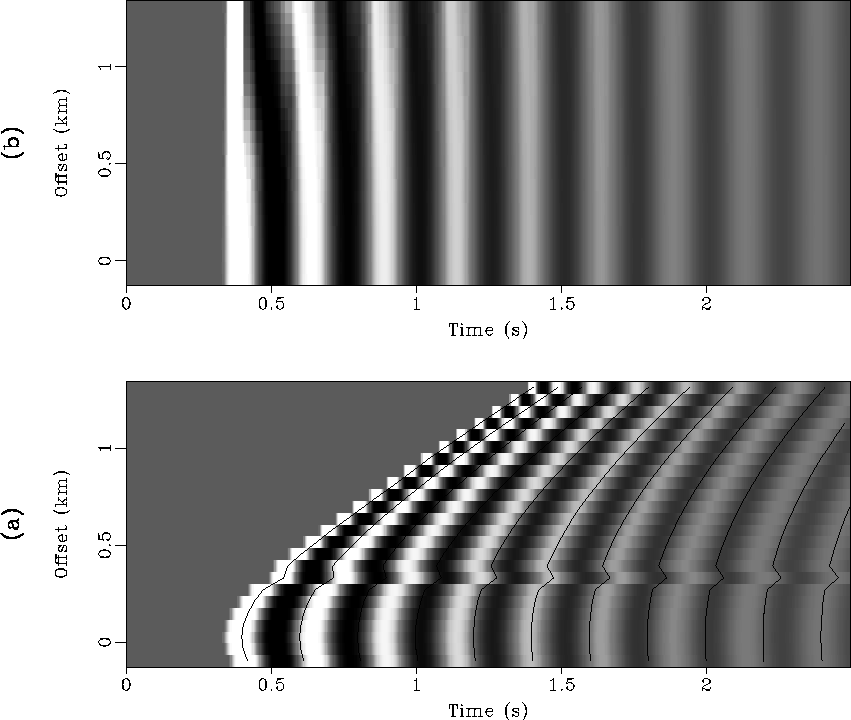
Now we use the same data to illustrate three applications of the algorithm.
The first one is event-picking. We can connect the short line-segments displayed in
Figure 3b to make curves that follow the events.
Figure 4a shows the result of the event-picking.
This procedure is useful in velocity analysis
and seismic data interpretation. The second application is to do moveout
corrections. Once events are picked, we can shift the traces
to flatten the curves in Figure 4a.
This gives us a result shown in Figure 4b. Because the
strategy of shifting is to make the traces at far offsets resemble
the traces at inner offsets, this algorithm is good for stacking data after
moveout corrections.
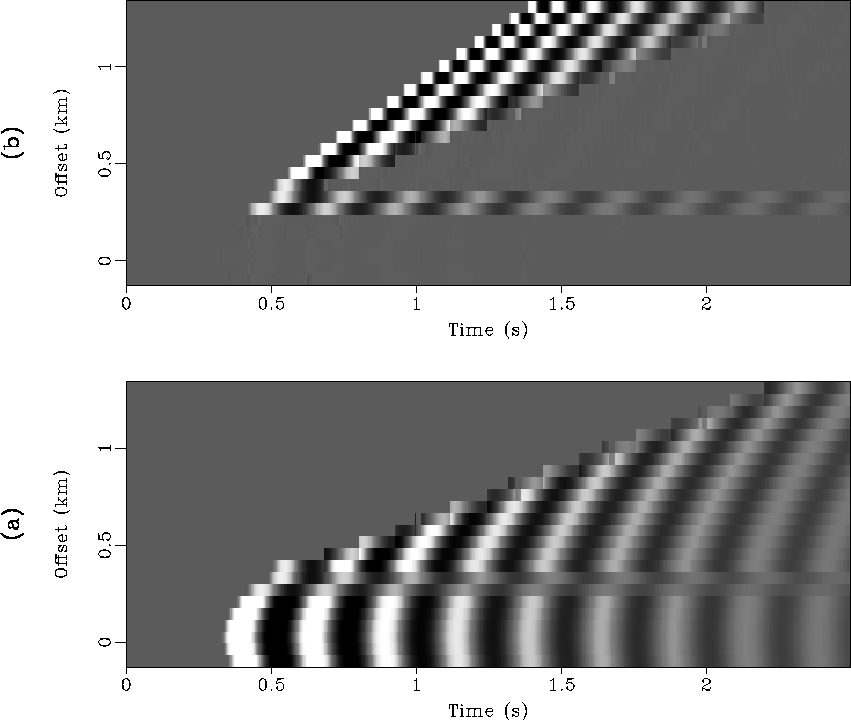
The last application is local dip-filtering.
The picked time-shift  at (t,x) tells us that
the data sample
at (t,x) tells us that
the data sample  matches the data sample u(t,x)
best. It also tells us that the dip at this location is
matches the data sample u(t,x)
best. It also tells us that the dip at this location is  .A local dip-filtering can be
done by subtracting
.A local dip-filtering can be
done by subtracting  from u(t,x) whenever
the dip at (t,x) is not in the passband. Figures 5a and
5b show the results of a low-pass dip-filter and a high-pass
dip-filter. This application would become very interesting if our algorithm
is generalized to multiple dip-picking.
from u(t,x) whenever
the dip at (t,x) is not in the passband. Figures 5a and
5b show the results of a low-pass dip-filter and a high-pass
dip-filter. This application would become very interesting if our algorithm
is generalized to multiple dip-picking.
sthyppick
Figure 3 An example of dip-picking with synthetic data: (a) a synthetic CMP gather
in which one trace is over-shifted on purpose, and events are aliased spatially
at far offsets; (b) picked dips are represented by short dipping line-segments
and are overlain on data.
sthypappl
Figure 4 Applications of the algorithm: (a) event-picking; (b) moveout corrections.
sthypdfil
Figure 5 Examples of local dip-filtering: (a) low-pass; (b) high-pass.
Next: Field data
Up: EXAMPLES
Previous: EXAMPLES
Stanford Exploration Project
1/13/1998