|
|
|
|
Earthquake extraction and correlation energy at Long Beach, California seismic survey |
 vertical-component geophones covering a region approximately
  km north-south by
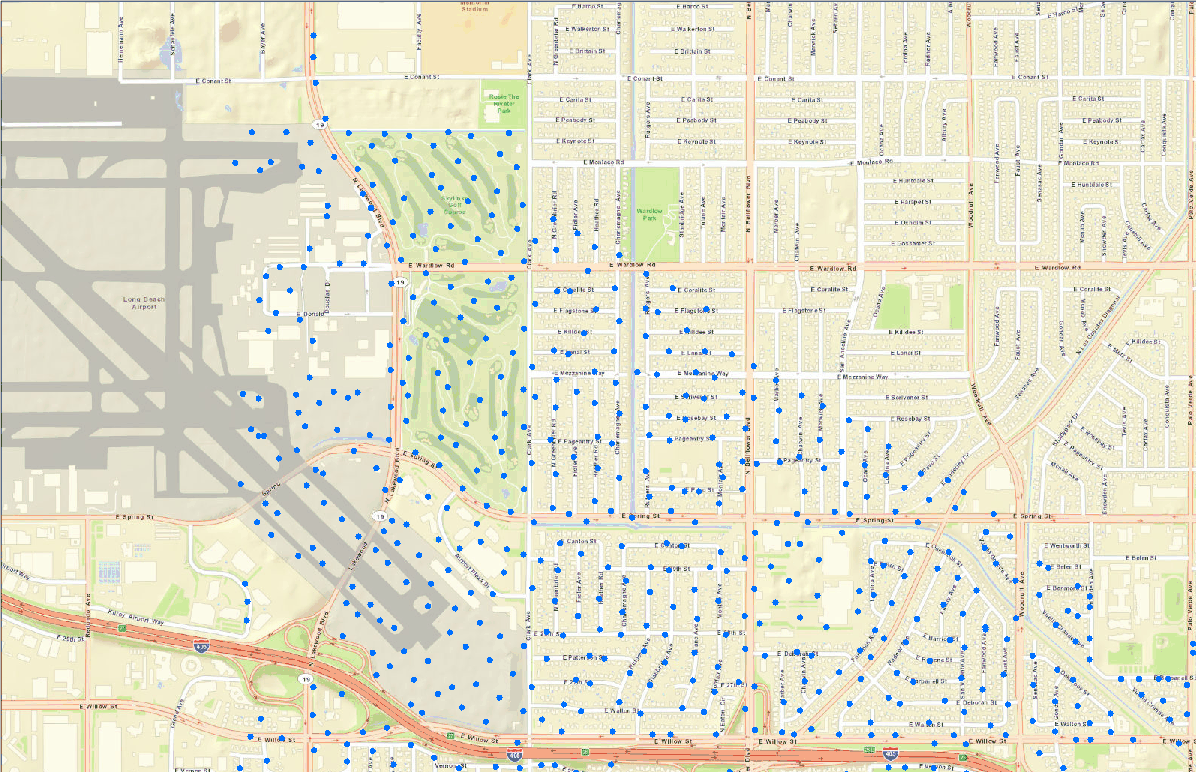
  km east-west (Figure 1). Average station spacing is
  m, both inline and crossline. While battery life limitations means stations are swapped out approximately every
  days, station locations stay consistent throughout the survey. Data were being continuously recorded (
 hours/day) over a span of four months starting in January
  , with a sampling rate of
  Hz. This has provided us with approximately
  TB of data. While the data have been low-cut at
  Hz, there is still energy found in the suppressed lower frequencies.
|
lbmap
Figure 1. Map of receivers comprising the Long Beach 3D seismic array. |
|
|---|---|
|
|
|
|
|
|
Earthquake extraction and correlation energy at Long Beach, California seismic survey |