|
|
|
|
Estimation of Q from surface-seismic reflection data in data space and image space |
Depth-migration Q analysis
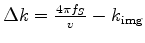
I use the wavenumber computed from surface offset-domain common-image gathers to improve the compensation Q function by performing a moveout analysis. A straightforward procedure to update the Q function is the following:
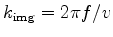 , which has an angle-dependent stretch of the vertical wavenumber
  according to the following relation:
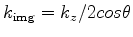 , where
  is the opening angle. For a flat reflector,
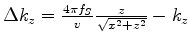
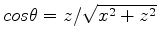 . Substituting this defined image wavenumber into equation 10, I get the central-image wavenumber shift in the following way:
 is the quality factor for forward modeling,
  is the quality factor for Q compensation, and
 , which is defined as the central-image wavenumber shift.
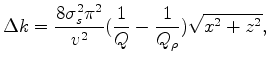
For the data generated by a flat reflector and homogeneous velocity and Q in Figures 1(a) and 1(b), images migrated or compensated using one shot at 0 m in Figure 3 is equivalent to a single image point at 0 m with respect to different source-receiver offsets. Although one shot is not enough for stacking during migration/compensation, it is still appropriate to analyze Q effect by using a limited range of the offsets.
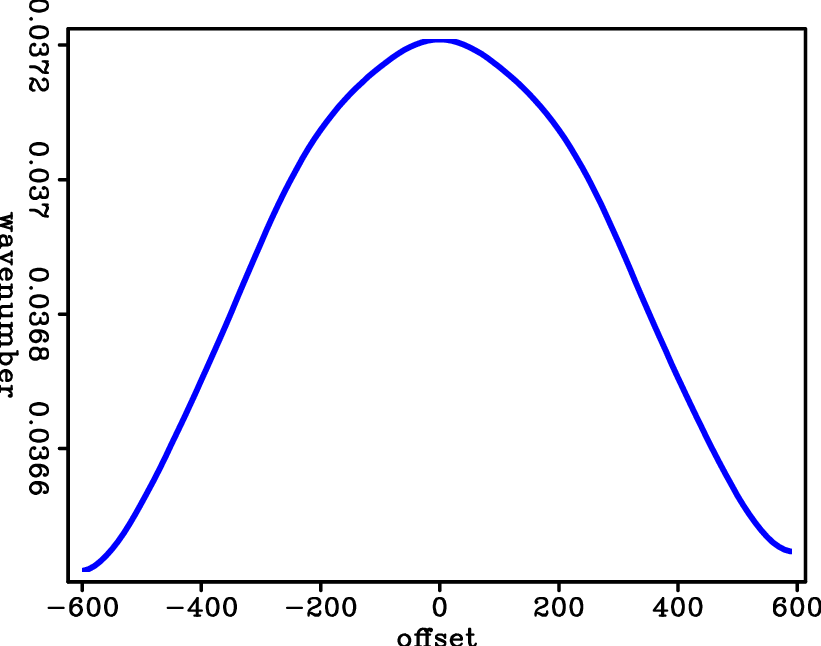
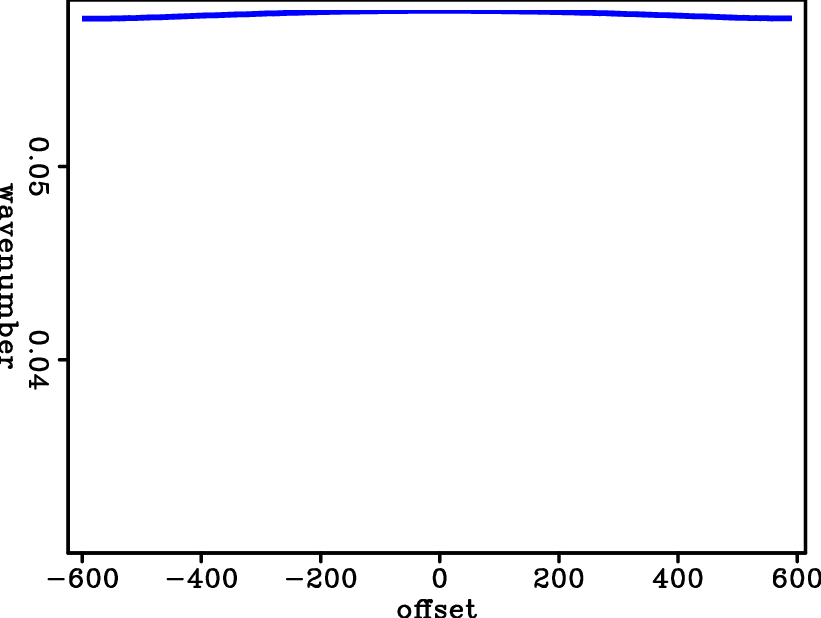
According to equation 23, if I plot the central-image wavenumber versus the offset or angle, the central wavenumber is flat with the correct Q for compensation, but shows a curvature with an incorrect Q for compensation. Figure 4(a) and 4(b) display the central image wavenumber of the image in Figure 3(b) and Figure 3(d). The central image wavenumber is almost flat over offsets in Figure 4(b) after being compensated with correct Q  . In contract, Figure 4(a) shows a curvature along offset, since infinite Q was used for compensation. The results indicate that central-wavenumber shift is related to attenuation and can be used to estimate Q in the image domain.
The image wavenumber
 , rather than the vertical wavenumber
, is used to relate to attenuation in this paper. The reason for not using
is that the central-vertical wavenumber shift is independent of the offset/angle for a simple model with a flat reflector, which can be shown as follows:
, rather than the vertical wavenumber
, is used to relate to attenuation in this paper. The reason for not using
is that the central-vertical wavenumber shift is independent of the offset/angle for a simple model with a flat reflector, which can be shown as follows:
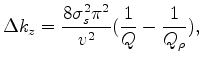 |
(24) |
 . Thus, the central-vertical-wavenumber shift can not be applied to QVO/QVA analysis nor to estimating Q.
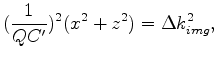 |
(25) |
 .
.
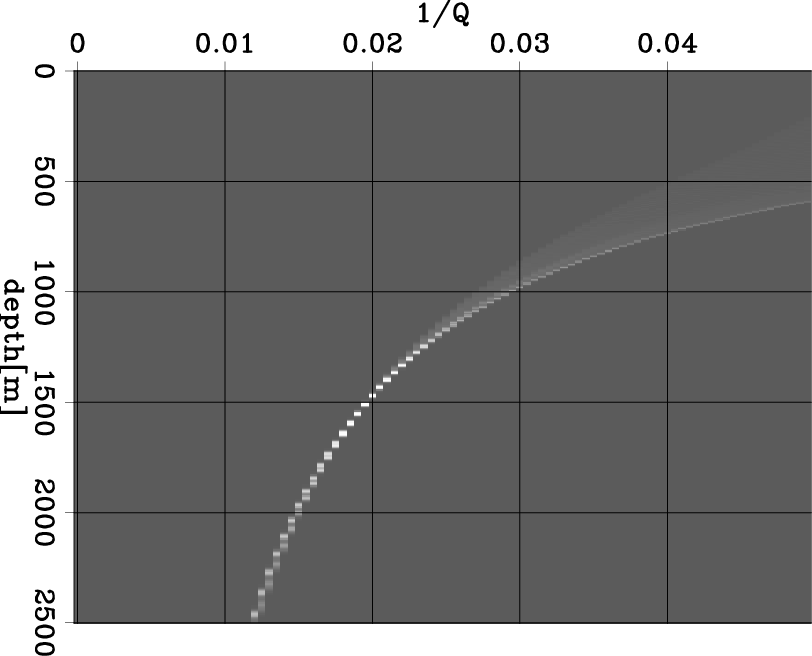
Figure 4(c) shows the Q spectra of Figure 3(b) that has incorrect Q for compensation. This result shows concentrated energy around the point (1500 m, 0.02), which indicates that the new RMS-Q is 50 above 1500 m. However, the energy is not as well focused as that in Figure 2(b), because of its relatively narrow range of offsets after imaging.
|
|---|
|
knqmig,kqmig,Qscanimg
Figure 4. Given the 2D synthetic example, (a) central image wavenumber with correct Q (Q=50) for compensation ; (b) central image wavenumer with incorrect Q (Q=99999) for compensation; (c) Q spectra of Figure 3(b) that has incorrect Q for compensation. |
|
|
|
|
|
|
Estimation of Q from surface-seismic reflection data in data space and image space |