|
|
|
|
Hypercube viewer |
|
|---|
|
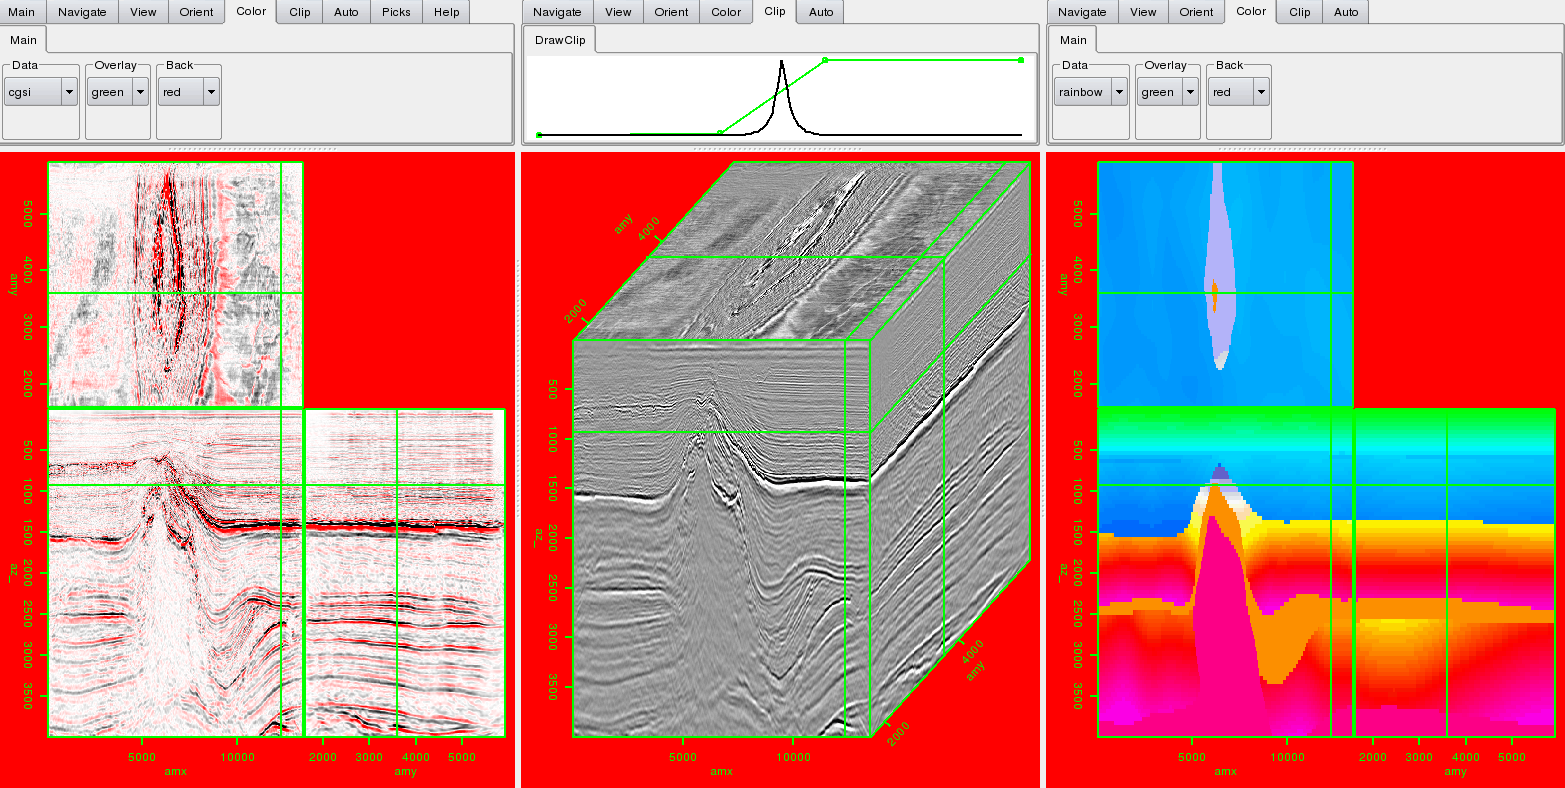
display
Figure 1. The display window with three different views. In this case three different datasets are being displayed. [NR] |
|
|
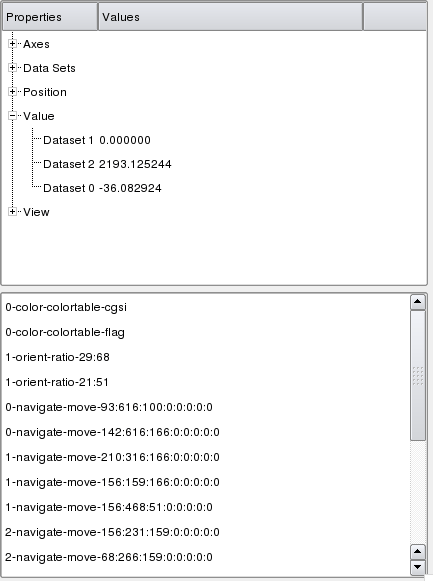
The status window (Figure 2) is broken into two parts: information and history. The top portion of the window information about the datasets currently shown. You can view: axes information (origin, sampling, number of samples, and axis label), the names of the datasets that were read in, which dataset you are currently viewing in each view, the position in the hypercube, and the data value in each dataset at the current position. The history window records every mouse and menu action taken and is more fully described later.
|
control
Figure 2. The control window. The top of half provides information about the dataset(s). The bottom shows the last ten actions performed by the user.[NR] |
|
|---|---|
|
|
|
|
|
|
Hypercube viewer |