|
|
|
|
Hypercube viewer |
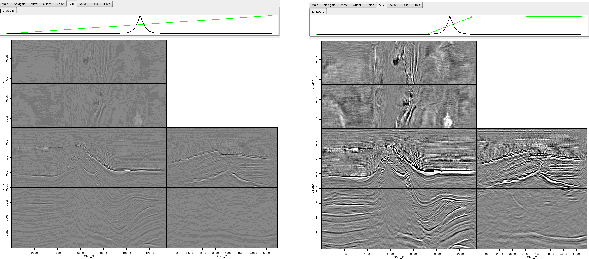
The second black line shows the mapping from these 256 different regions to the 256 different colors in the colormap. By default the first region maps to the first color map value, the second to the second, etc. The horizontal axis is the regions and the vertical axis is the color map index. The black line is constructed by linearly interpolating between control points, (note the squares at the far ends of the display). The right mouse button creates additional control points can be added (the center button deletes the points). If you wish to increase the dynamic range, you can introduce additional control points. Figure 5 shows an example. The left panel is the original data; the right panel is after adding control points that map outlying data values to the same color map index. Note how the right panel of Figure 5 shows much more dynamic range.
|
|---|
|
clip
Figure 5. The effect of adjusting the clip. The left panel shows the original data and clip. In the right panel the clip has been adjusted by adding control points closer the range of most of the data's value. Note how the image on the right shows significantly more dynamic range. [NR] |
|
|
|
|
|
|
Hypercube viewer |