|
|
|
|
|
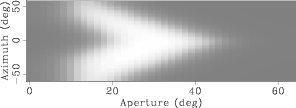
ap-az-mask
Figure 25. Mask to select the aperture angle-reflection azimuth combination illuminating the primary. White is one. |
|
|---|---|
|
|
To assess how much of the multiple can be attenuated in the angle stack of the data I stacked
the masked versions of both the primary and the multiple. In both cases I normalized by the
number of traces (azimuths and aperture angles) that actually contributed to the stack
given the mask. Figure 26 shows the results and is completely
analogous to Figure 23. All panels are clipped at the maximum
amplitude of the masked primary. The azimuth filtering decreased the overall energy of the
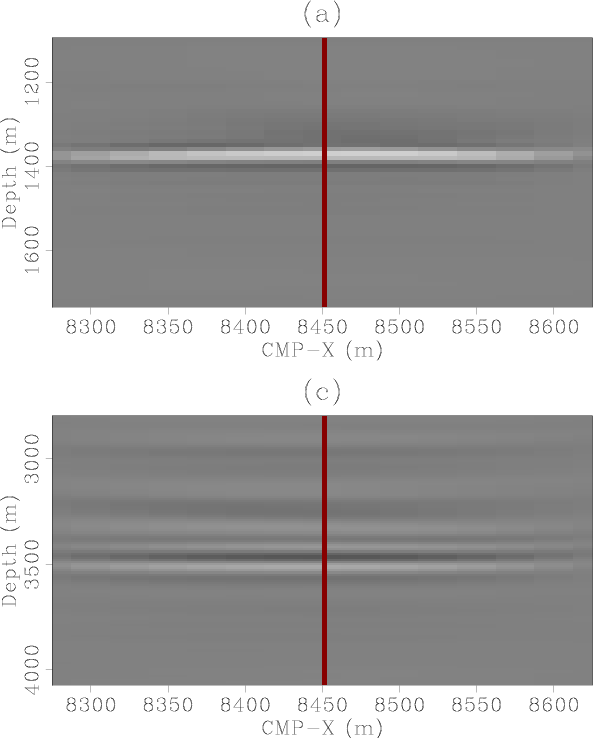
already weak multiple. To better see the effect of the azimuth filtering, I plotted
in Figure 27 the
same data such that the primary is clipped at its maximum masked value and the multiple
is clipped at the amplitude of the masked primary divided by the ratio between the
maximum amplitudes of the un-masked primaries and the un-masked multiples, so that the
figure is directly comparable to Figure ![]() .
Notice that the azimuth filtering decreased the overall amplitude of the multiple but did
not appreciably alter its character.
.
Notice that the azimuth filtering decreased the overall amplitude of the multiple but did
not appreciably alter its character.
|
|---|
|
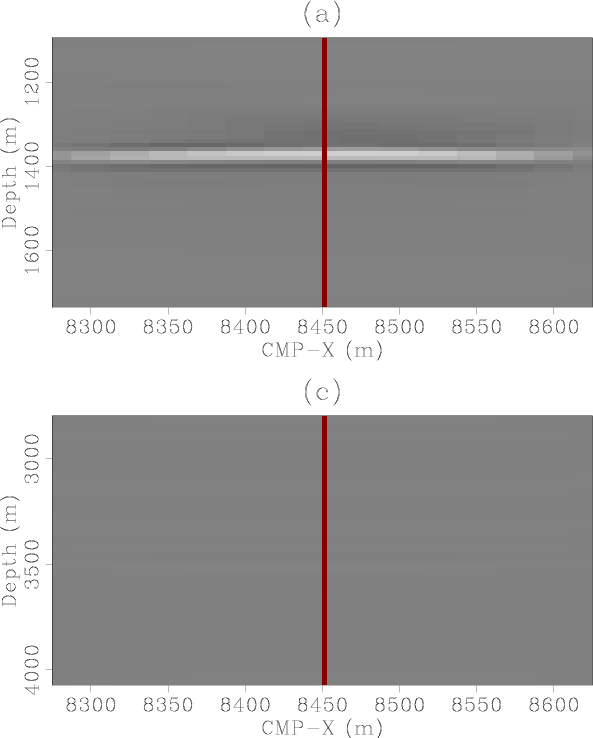
masked-az-stack-clip1
Figure 26. Stack over reflection azimuth and aperture angle of the masked 3D ADCIGs for the water-bottom primary (panel (a)) and the water-bottom multiple (panel (b)). All panels clipped at the maximum amplitude of the primary. |
|
|
|
|---|
|
masked-az-stack-clip2
Figure 27. Stack over reflection azimuth and aperture angle of the masked 3D ADCIGs for the water-bottom primary (panel (a)) and the water-bottom multiple (panel (b)). Panels (a) and (b) clipped at the maximum amplitude of the masked primary and panels (c) and (d) clipped at that amplitude divided by the ratio between the maximum amplitude of the un-masked primary and the maximum amplitude of the un-masked multiple. |
|
|
|
|
|
|