

Next: Back-projection by wavefield injection
Up: Solving the Forward Modeling
Previous: Radiation Patterns and Free-surface
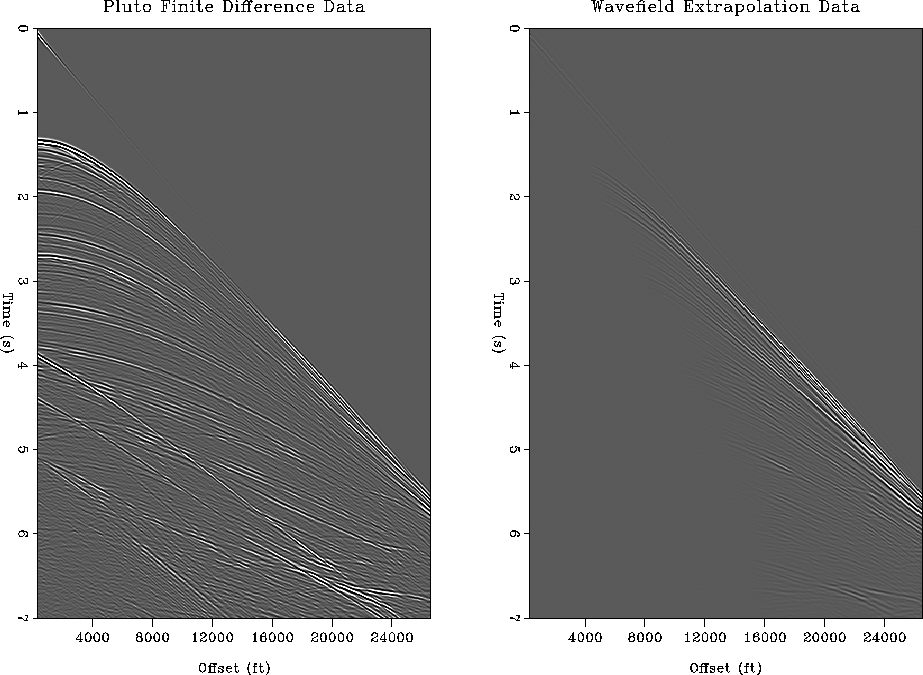
Figure 6 presents forward modeling results for the Pluto dataset. The left and right panels show the wavefield generated by a fourth-order FD and RWE modeling, respectively. The finite-difference Pluto data on the left is the pressure field component calculated in an elastic model. The RWE data in the right panel are generated according to equation 32. Note that the reflections apparent near zero-offset in the left panel are completely absent from the right panel. This is because the algorithm cannot propagate reflected waves directly upwards on near-vertical paths because propagation angles are too steep to the extrapolation axis. The wavefields at farther offsets (i.e. >16kft), though, become increasingly similar both kinematically and dynamically.
DataCompare
Figure 6 Comparison of the Pluto dataset wavefield generated by a fourth-order finite difference approach (left panel) and the wavefield generated by the RWE modeling approach (right panel) for a source position at 80 kft.


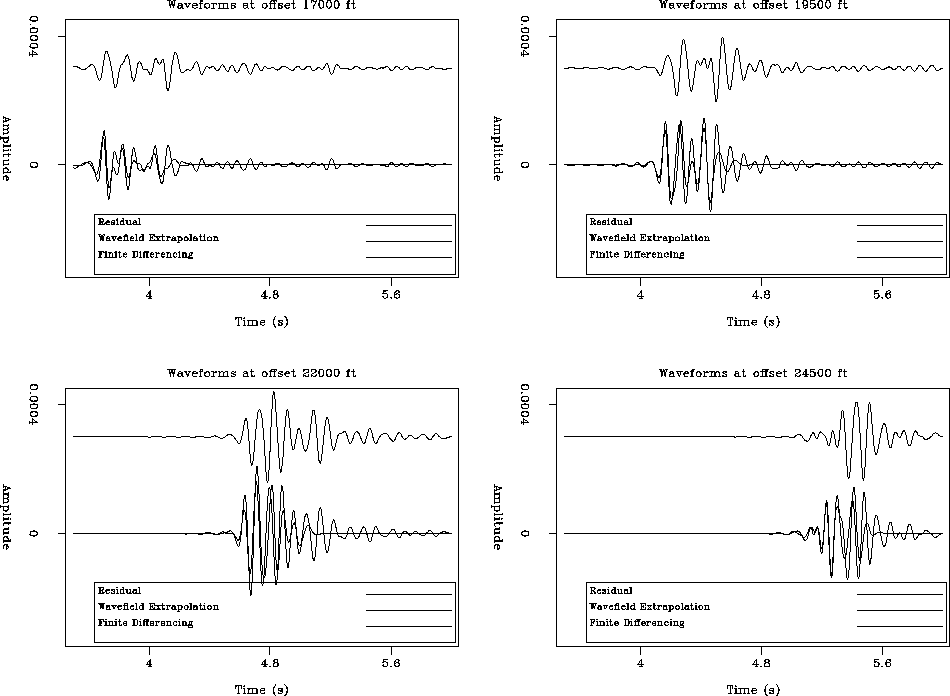
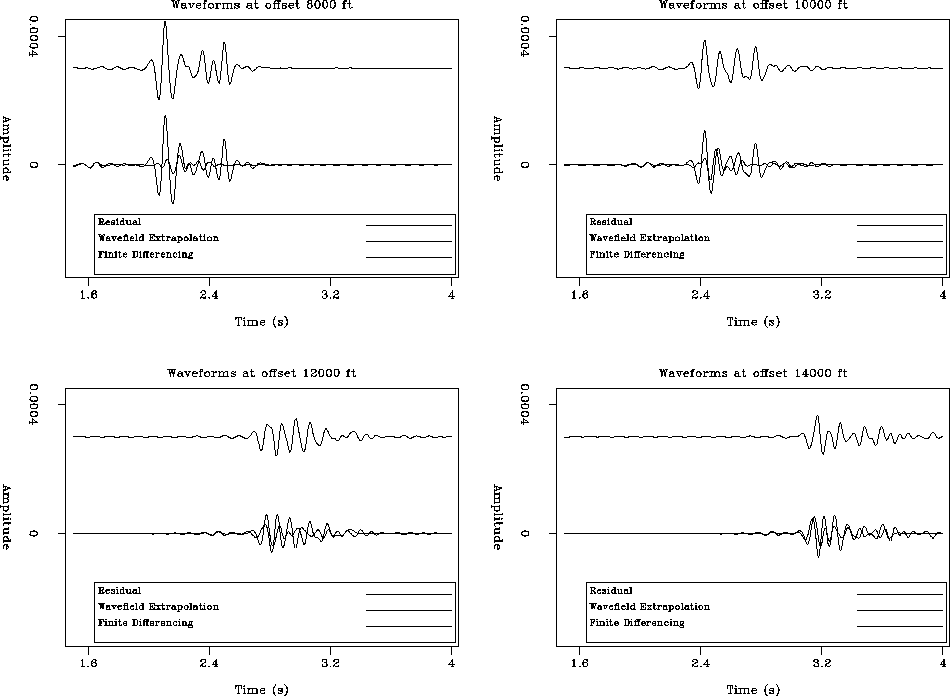
The waveforms input to the inversion algorithm at exploration scale are usually limited to the first few hundred milliseconds after the first arrival. Hence, examining the match between FD and RWE waveforms in this time interval provides insight into the quality of the forward modeling results. Figures 7 and 8 present waveform comparisons at four wide-offsets (>15kft) and four near-offsets (<15kft), respectively. Both waveforms are low-pass filtered to a frequency band typically used for exploration-scale waveform inversion (high corner of 12 Hz). At far offsets the RWE waveforms match those from the FD modeling to a good degree, especially directly after the first arrival. The matches at nearer offsets are fairly poor as expected given the obviously disparate nature of the wavefields shown in figure 6, though show improvements with increasing offset.
WideOffsets
Figure 7 Examples of waveform matching for various wide offsets, with the corresponding residuals for the wavefields shown in figure 6. Top left: 17 kft offset; top right: 19.5 kft offset; bottom left: 22 kft offset; and bottom right: 24.5 kft offset.


 NearOffsets
Figure 8 Examples of waveform matching for various near offsets, with the corresponding residuals for the wavefields shown in figure 6. Top left: 8 kft offset; top right: 10 kft offset; bottom left: 12kft offset; and bottom right: 14 kft offset.


Next: Back-projection by wavefield injection
Up: Solving the Forward Modeling
Previous: Radiation Patterns and Free-surface
Stanford Exploration Project
1/16/2007


