


Next: Path View: visualization of
Up: Velocity View: data-fusion of
Previous: Data-fusion using deviation-dependent weighting
In practice, the user will often want to control how closely the synthesized volume resembles the low-frequency volume rather than the high-frequency volume, or vice versa. The interface for Velocity View provides a slider bar to control the level of contribution to the result  from the source volumes
  and
and  . As the slider moves from left to right, a linear scale from 0 to 1 is traversed. Denoting the current slider value
  , is generated by
| 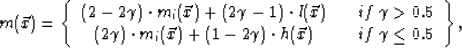 |
(5) |
where  indicates which one of the two data-fusion algorithms previously discussed is used. The construction in Eq. 5 has the following desirable behavior that 1) as
  ,
,  ; 2) as
  ,
,  ; and 3) as
  ,
,  . For any value of , is defined to be a convex combination of
  and either or , depending on whether or not
  .
.
Next: Path View: visualization of
Up: Velocity View: data-fusion of
Previous: Data-fusion using deviation-dependent weighting
Stanford Exploration Project
1/16/2007