![[*]](http://sepwww.stanford.edu/latex2html/cross_ref_motif.gif) . The model was developed from the
combination of surface geologic observations, well-ties from 8-10
nearby wells and walk-away VSPs.
. The model was developed from the
combination of surface geologic observations, well-ties from 8-10
nearby wells and walk-away VSPs.
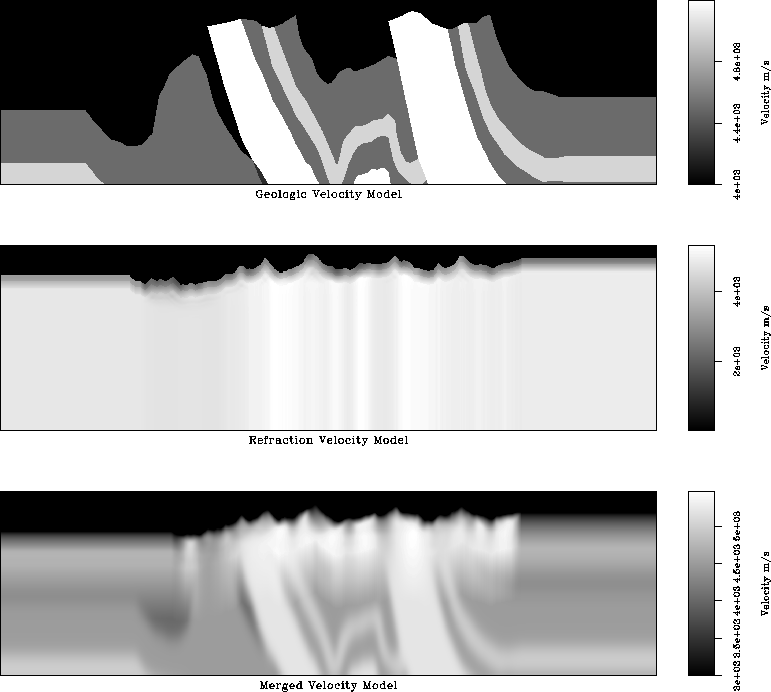
Husky Oil also included a geologically derived velocity model in their
deliverables. The near-surface component of this model is shown in
top panel of figure ![[*]](http://sepwww.stanford.edu/latex2html/cross_ref_motif.gif) . The model was developed from the
combination of surface geologic observations, well-ties from 8-10
nearby wells and walk-away VSPs.
. The model was developed from the
combination of surface geologic observations, well-ties from 8-10
nearby wells and walk-away VSPs.
 |
Refraction tomography inversion of first-break arrival times
(c.f. figure ![[*]](http://sepwww.stanford.edu/latex2html/cross_ref_motif.gif) ) provided a better estimate of the
near-surface velocity profile (middle panel). The top 200 m of the
refraction tomography model were grafted onto the geologic model, which
was subsequently smoothed to create the migration velocity profile
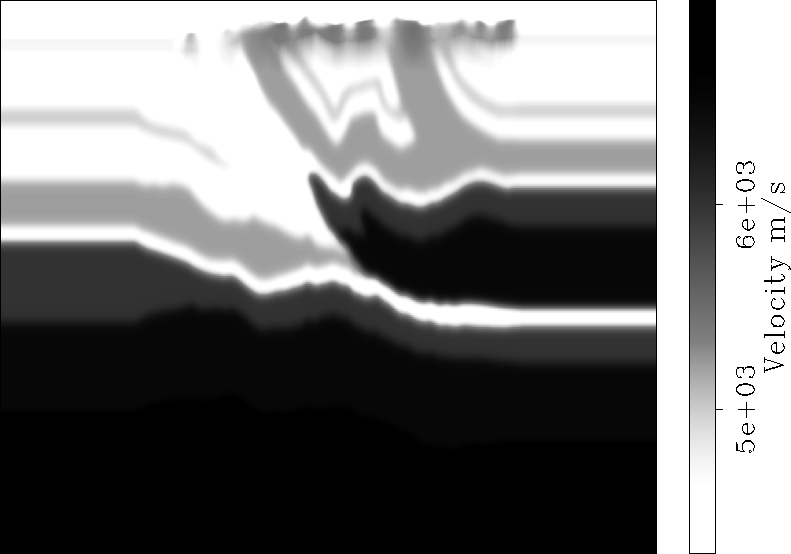
(bottom panel). The full migration velocity profile
(figure
) provided a better estimate of the
near-surface velocity profile (middle panel). The top 200 m of the
refraction tomography model were grafted onto the geologic model, which
was subsequently smoothed to create the migration velocity profile
(bottom panel). The full migration velocity profile
(figure ![[*]](http://sepwww.stanford.edu/latex2html/cross_ref_motif.gif) ) shows an intricate near-surface geologic
environment characterized by complex faulting and folding and strong
velocity contrast. Near-surface velocities are seismically fast with
values ranging between 3600 m/s and 4800 m/s.
) shows an intricate near-surface geologic
environment characterized by complex faulting and folding and strong
velocity contrast. Near-surface velocities are seismically fast with
values ranging between 3600 m/s and 4800 m/s.
 |