

Next: Conclusion
Up: Artman: Direct migration
Previous: Direct migration
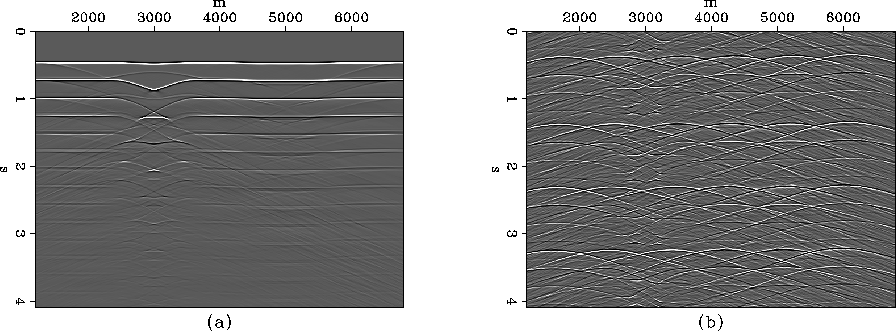
Data was also synthesized through a model containing two
synclines. Figure ![[*]](http://sepwww.stanford.edu/latex2html/cross_ref_motif.gif) a shows summed
wavefields with the same direct arrival time. Panel (b) is the
sum of the same wavefields after applying random phase delays to
each. Panel (b) has all sources firing within the 4 seconds
plotted, which results in some wrap-around. Bandlimited impulses were
used as sources without any addition of randomness.
a shows summed
wavefields with the same direct arrival time. Panel (b) is the
sum of the same wavefields after applying random phase delays to
each. Panel (b) has all sources firing within the 4 seconds
plotted, which results in some wrap-around. Bandlimited impulses were
used as sources without any addition of randomness.
dat.syn
Figure 5 (a) Perfectly stacked
shots from a double syncline model. (b) Stack of wavefields
after applying a random time delay in the Fourier domain.


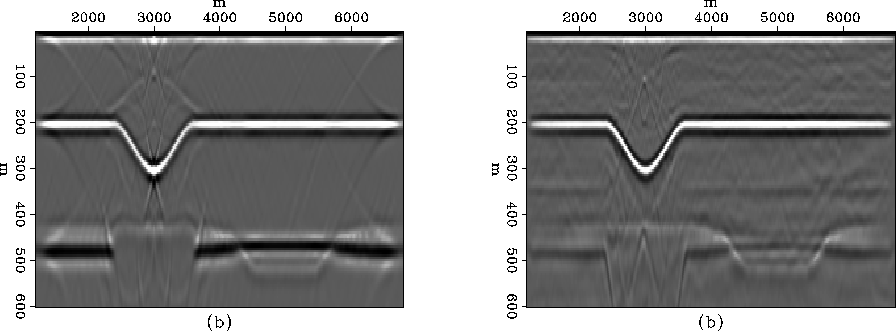
Figure ![[*]](http://sepwww.stanford.edu/latex2html/cross_ref_motif.gif) shows zero offset images produced by
direct migration of the data shown in Figure
shows zero offset images produced by
direct migration of the data shown in Figure ![[*]](http://sepwww.stanford.edu/latex2html/cross_ref_motif.gif) . Panel
(b) is not as high quality as panel (a). A faint
reflection mimicking the first event can be seen at z=350m. This could be
in part from events wrapping around the time axis when applying their
respective phase delays. This is probably a worst-case result, that
can be avoided by processing a time-window several times longer than
the minimum, t. Given the dramatic departure of the data
Figure
. Panel
(b) is not as high quality as panel (a). A faint
reflection mimicking the first event can be seen at z=350m. This could be
in part from events wrapping around the time axis when applying their
respective phase delays. This is probably a worst-case result, that
can be avoided by processing a time-window several times longer than
the minimum, t. Given the dramatic departure of the data
Figure ![[*]](http://sepwww.stanford.edu/latex2html/cross_ref_motif.gif) b) from a horizontal planewave source, significant
energy may also be at
b) from a horizontal planewave source, significant
energy may also be at  . The most obvious difference is
the diminution of the multiple from the first reflector at z=485.
The second reflector is much clearer in panel (b) without its
interference.
mig.syn.norand
Figure 6 (a)  image produced by direct migration of
Figure
 ![[*]](http://sepwww.stanford.edu/latex2html/cross_ref_motif.gif) panel (a). (b)
panel (a). (b)  image produced by direct migration of
Figure
 ![[*]](http://sepwww.stanford.edu/latex2html/cross_ref_motif.gif) panel (b).
panel (b).


Next: Conclusion
Up: Artman: Direct migration
Previous: Direct migration
Stanford Exploration Project
10/31/2005
![[*]](http://sepwww.stanford.edu/latex2html/cross_ref_motif.gif) a shows summed
wavefields with the same direct arrival time. Panel (b) is the
sum of the same wavefields after applying random phase delays to
each. Panel (b) has all sources firing within the 4 seconds
plotted, which results in some wrap-around. Bandlimited impulses were
used as sources without any addition of randomness.
a shows summed
wavefields with the same direct arrival time. Panel (b) is the
sum of the same wavefields after applying random phase delays to
each. Panel (b) has all sources firing within the 4 seconds
plotted, which results in some wrap-around. Bandlimited impulses were
used as sources without any addition of randomness.

