

Next: Application to linearized downward
Up: Vlad and Tisserant: Improving
Previous: Introduction
The velocity model used by Vlad et al. (2003) for examining
the effects of the amplitude corrections was particularly unsuitable
for the problem. It belonged actually to a limit case in which the
amplitude corrections canceled themselves. We will show below why that
was the case and we will analyze the effects of the corrections by
picking amplitudes at each midpoint in a wavefield depth slice.
At each downward continuation step, the propagation amplitude
correction applied to the wavefield is:
| ![\begin{displaymath}
P'_z = P_z e^{-\frac{v_z\Delta z}{2v\left(x,z\right)} \frac{1}{1-\left[\frac{v\left(x,z\right)k_x}{\omega}\right]^2} },\end{displaymath}](img1.gif) |
(1) |
where vz denotes the vertical gradient of the velocity. When variations of velocity in the x direction exist, this
exponential is strictly noncommutative with the downward continuation
step. The noncommutativity however becomes weak in the particular case
when the laterally varying velocity is symmetrical with respect to a
horizontal plane. In the case of such symmetry, corrections of the
same magnitude along midpoint, but of different sign (because of an
opposing sign for vz) cancel each other. The corrections in the
lower half of the velocity model in Figure 3 of
Vlad et al. (2003) were therefore erasing the effects of
the ones performed in the upper half. As a result, Figure 4 of
Vlad et al. (2003) was not showing any results of the
correction.
Recognizing that such a
symmetrical configuration is not very plausible geologically, we
downward continued (with split-step) only through the upper half of the respective
velocity model. This half is depicted in Figure 1.
g1
Figure 1 Top panel: Upper half of the
velocity model used by Vlad et al. (2003). Figure
2 shows the amplitudes produced by propagation through
this velocity model. Bottom panel: Rays shot from (0,0),
shown for an enhancement of the intuitive appreciation of the
focusing during the propagation.

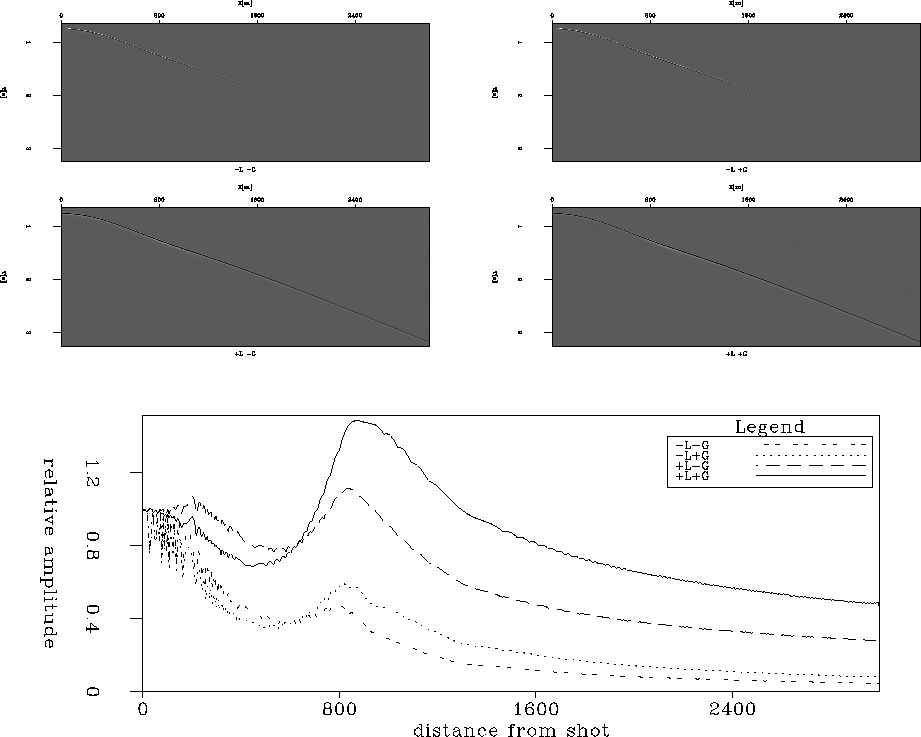
The top panels in Figure 2 show the wavefield at a depth
of 1000m. The four panels represent all the combinations of applying
(``+'') or not (``-'') the boundary condition correction (``L'') and/or the
propagation correction (``G''). The lower half of the figure shows the
maximum amplitudes picked for each midpoint. The effect of the
propagation correction (Curves ``-L+G'' and ``+L+G'') is visible now as
increased focusing and reduced amplitude decay with offset. The
boundary condition correction (Curves ``+L-G'' and ``+L+G'') also has a strong
effect; it especially diminishes the amplitude decay. We expect the
two Zhang corrections to increase, when cummulated, power for large
dips and for large incidence angles on the reflector.
g2
Figure 2 ``L'' denotes the
boundary condition correction, ``G'' denotes the propagation
correction, a "+'' shows that the respective correction was applied,
and a ``-'' shows that it was not. Top panels: Wavefield generated
by a shot at (0,0) in the velocity model from Figure 1,
and recorded at the bottom of that velocity model. Bottom
panel: Maximum amplitudes picked for each x location in the top panels.


Next: Application to linearized downward
Up: Vlad and Tisserant: Improving
Previous: Introduction
Stanford Exploration Project
5/23/2004

