

Next: Future work: finding the
Up: Guitton and Vlad: Imaging
Previous: Introduction
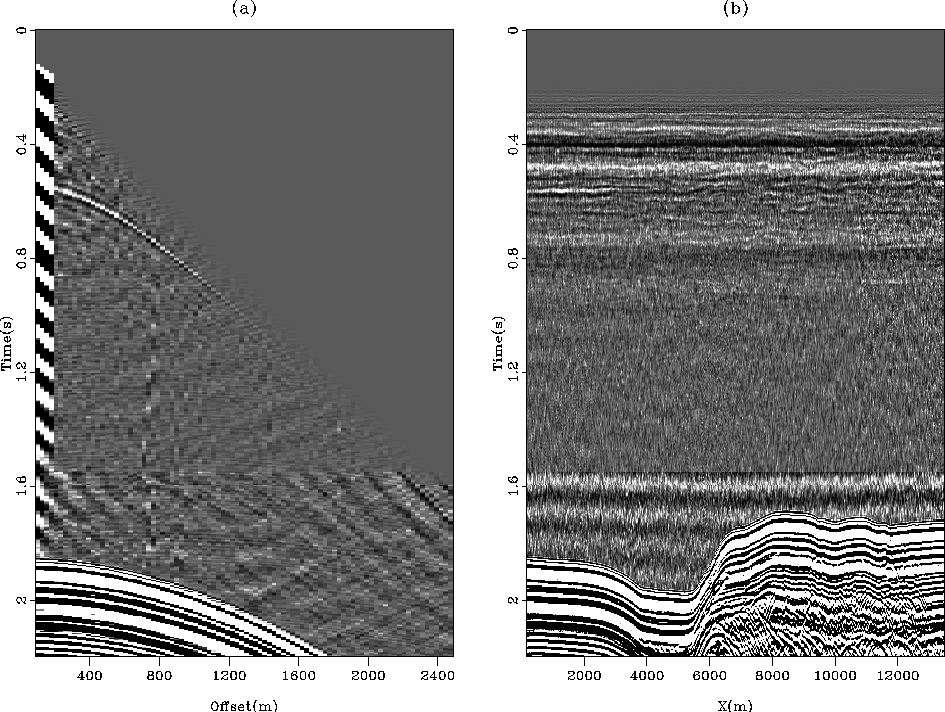
Figure 1 shows the input data from the Gulf of Mexico
with a strong source component that masks the water column
reflections (Figure 1a). Our goal is to unravel
these reflections by performing signal/noise separation.
We opted for a pattern-based signal/noise separation technique with
stationary prediction-error filters Guitton (2003b).
This technique separates the signal and the noise by assuming that both
components have different multivariate spectra that PEFs approximate. Therefore, we needed one PEF for the noise
and one PEF for the signal. We designed 2D PEFs on common-shot gathers.
The noise level is so overwhelming that designing a model for it was relatively easy.
We selected nine shot gathers with no water column reflections. This
choice was made by inspecting all shot gathers after applying a high-pass
filter to them to remove most of the source energy. We then stacked
the selected gathers to increase the noise coherency and attenuate any
remaining signal.
From this noise model we estimated a stationary 25  5 PEF.
The signal PEF was obtained using the Spitz approximation
Guitton (2004). The size of the signal PEF is 5
 2. Having had estimated the noise and signal PEFs, we proceeded
to perform noise removal. Figure 2 displays the estimated
signal. A reflection is clearly visible in Figure 2a.
Figures 1 and 2 have the same clip
for direct comparison. In Figure 2b, the thermohaline
structure of the water column is revealed. We followed with a 10-60 Hz
bandpass, a gain with the first power of time, and a mute. Since several near
offsets needed for prestack wavefield-continuation migration were missing (not
acquired or lost to PEFs boundaries), we used an offset continuation
tool for regularly sampled data Vlad and Biondi (2001). An image of
the denoised data prestack migrated with a constant velocity of 1520
m/s is shown in Figure 3. The reflections are clearly visible throughout
the section. The coherency of these events decreases for depths
greater than 600m.
data
Figure 1 Input data showing the source noise in
(a) a shot gather (x=2500 m) and (b) a constant-offset section
(h=130 m). The water bottom is visible below 1.6 s. R points to a
water reflection mostly hidden by the noise.
 signal
Figure 2 Estimated signal for (a) a shot gather
(x=2500 m) and (b) a constant offset section (h=130 m). The water
reflections are now clearly visible above 1.6 s. The four bad traces
in (a) come from the boundary conditions for the PEFs.
 stac7
stac7
Figure 3 Migration of the denoised
data with a constant velocity of 1520 m/s.


Next: Future work: finding the
Up: Guitton and Vlad: Imaging
Previous: Introduction
Stanford Exploration Project
5/23/2004
![]() 5 PEF.
The signal PEF was obtained using the Spitz approximation
Guitton (2004). The size of the signal PEF is 5
5 PEF.
The signal PEF was obtained using the Spitz approximation
Guitton (2004). The size of the signal PEF is 5
![]() 2. Having had estimated the noise and signal PEFs, we proceeded
to perform noise removal. Figure 2 displays the estimated
signal. A reflection is clearly visible in Figure 2a.
Figures 1 and 2 have the same clip
for direct comparison. In Figure 2b, the thermohaline
structure of the water column is revealed. We followed with a 10-60 Hz
bandpass, a gain with the first power of time, and a mute. Since several near
offsets needed for prestack wavefield-continuation migration were missing (not
acquired or lost to PEFs boundaries), we used an offset continuation
tool for regularly sampled data Vlad and Biondi (2001). An image of
the denoised data prestack migrated with a constant velocity of 1520
m/s is shown in Figure 3. The reflections are clearly visible throughout
the section. The coherency of these events decreases for depths
greater than 600m.
2. Having had estimated the noise and signal PEFs, we proceeded
to perform noise removal. Figure 2 displays the estimated
signal. A reflection is clearly visible in Figure 2a.
Figures 1 and 2 have the same clip
for direct comparison. In Figure 2b, the thermohaline
structure of the water column is revealed. We followed with a 10-60 Hz
bandpass, a gain with the first power of time, and a mute. Since several near
offsets needed for prestack wavefield-continuation migration were missing (not
acquired or lost to PEFs boundaries), we used an offset continuation
tool for regularly sampled data Vlad and Biondi (2001). An image of
the denoised data prestack migrated with a constant velocity of 1520
m/s is shown in Figure 3. The reflections are clearly visible throughout
the section. The coherency of these events decreases for depths
greater than 600m.


