

Next: Conclusions and Future Work
Up: Alvarez: Genetic Algorithm Inversion
Previous: Summary of Evolution Parameters
Having chosen the evolution parameters that provided the best results for
both the standard and the micro-GA (Tables 1 and 2),
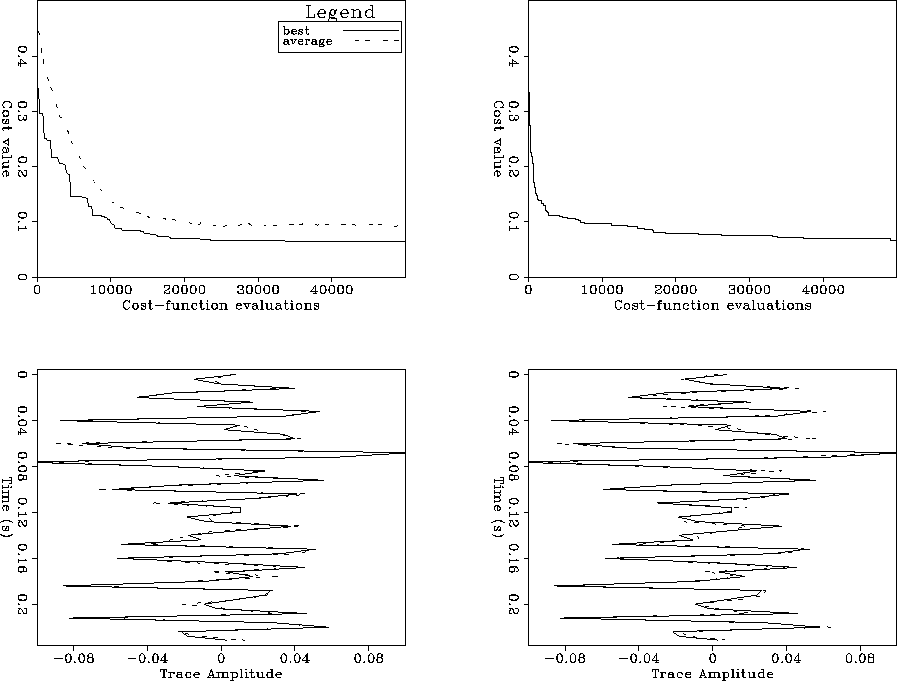
I will now compare the performance of the two in solving the current problem.
The top panels of Figure ![[*]](http://sepwww.stanford.edu/latex2html/cross_ref_motif.gif) show a comparison of
convergence rates between the standard genetic algorithm (left) and the
micro-genetic algorithm (right). The difference in convergence rate is
in the first generations is impressive. For example, the micro-genetic
algorithm would have essentially converged after 2000 cost-function evaluations,
whereas the standard genetic algorithm would take almost 10000
cost-function evaluations to reach the same convergence level. If enough
iterations (generations) are allowed both algorithms will converge to essentially
the same result.
The bottom panels in Figure
show a comparison of
convergence rates between the standard genetic algorithm (left) and the
micro-genetic algorithm (right). The difference in convergence rate is
in the first generations is impressive. For example, the micro-genetic
algorithm would have essentially converged after 2000 cost-function evaluations,
whereas the standard genetic algorithm would take almost 10000
cost-function evaluations to reach the same convergence level. If enough
iterations (generations) are allowed both algorithms will converge to essentially
the same result.
The bottom panels in Figure ![[*]](http://sepwww.stanford.edu/latex2html/cross_ref_motif.gif) show the corresponding
trace match. The differences are not too great because both algorithms were
essentially run to convergence.
show the corresponding
trace match. The differences are not too great because both algorithms were
essentially run to convergence.
final_comparison
Figure 11 Comparison between the standard
and the micro genetic algorithm. Top panels convergence rates for standard
genetic algorithm (left) and micro genetic algorithm (right). Bottom panels
show the corresponding trace match with continuous line representing the
original trace and the dotted line the inverted ones.


Next: Conclusions and Future Work
Up: Alvarez: Genetic Algorithm Inversion
Previous: Summary of Evolution Parameters
Stanford Exploration Project
11/11/2002
![[*]](http://sepwww.stanford.edu/latex2html/cross_ref_motif.gif) show a comparison of
convergence rates between the standard genetic algorithm (left) and the
micro-genetic algorithm (right). The difference in convergence rate is
in the first generations is impressive. For example, the micro-genetic
algorithm would have essentially converged after 2000 cost-function evaluations,
whereas the standard genetic algorithm would take almost 10000
cost-function evaluations to reach the same convergence level. If enough
iterations (generations) are allowed both algorithms will converge to essentially
the same result.
The bottom panels in Figure
show a comparison of
convergence rates between the standard genetic algorithm (left) and the
micro-genetic algorithm (right). The difference in convergence rate is
in the first generations is impressive. For example, the micro-genetic
algorithm would have essentially converged after 2000 cost-function evaluations,
whereas the standard genetic algorithm would take almost 10000
cost-function evaluations to reach the same convergence level. If enough
iterations (generations) are allowed both algorithms will converge to essentially
the same result.
The bottom panels in Figure ![[*]](http://sepwww.stanford.edu/latex2html/cross_ref_motif.gif) show the corresponding
trace match. The differences are not too great because both algorithms were
essentially run to convergence.
show the corresponding
trace match. The differences are not too great because both algorithms were
essentially run to convergence.
