

Next: Summary of Evolution Parameters
Up: Micro-Genetic Algorithm
Previous: Micro-Genetic Algorithm
In principle, micro-genetic algorithms are similar to the standard genetic
algorithm described in the previous section, in the sense of sharing the same
evolution parameters and
similar considerations. There is, however, an important distinction: since new
genetic material is introduced into the population every time the algorithm is
restarted, there is really no need for either jump or creep mutation.
Also, elitism is required, at least every time the population
is restarted, otherwise the algorithm would lose its exploitation capability.
I have also found that the algorithm is much less sensitive to the choice of
evolution parameters compared with the standard genetic algorithm. In particular,
population sizes of 5 to 7 with crossover rates of 0.8 to 0.95 give very good
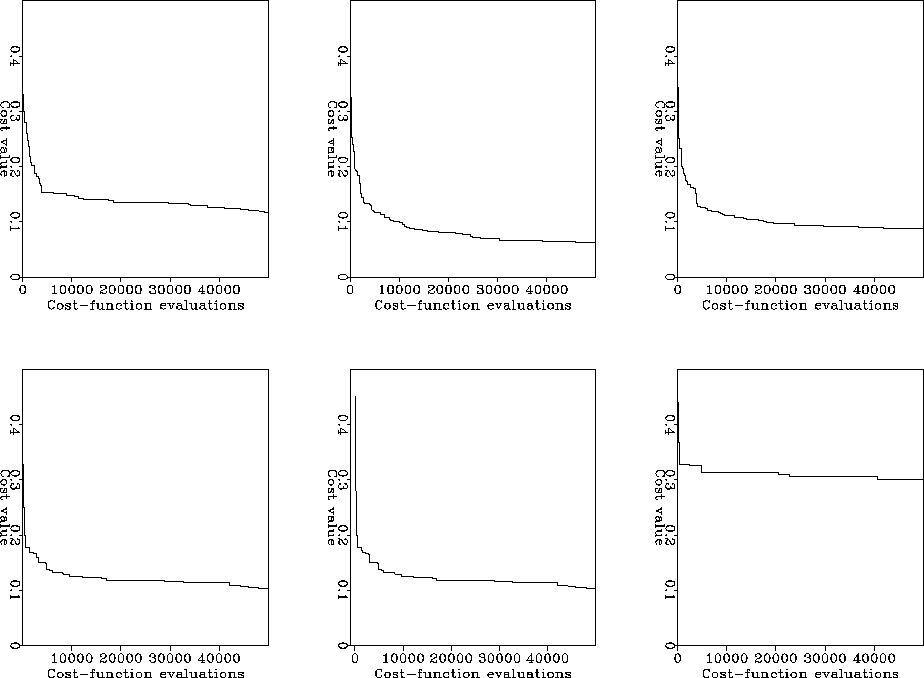
results. The top panels of
Figure ![[*]](http://sepwww.stanford.edu/latex2html/cross_ref_motif.gif) shows a comparison of convergence rates for
populations of 3, 5 and 7 individuals. It seems clear that 5 individuals is
the best. This result agrees with Carroll's who employed micro-GAs to optimize
an engineering problem Carroll (1996). The bottom panels show a comparison of
convergence rates for populations of 5
individuals and crossover rates of 0.7, 0.9 and 1.0. It seems that 0.9 is the
best crossover rate, although further tests showed that 0.95 gave even better
results and therefore that value was chosen for the remaining tests.
Figure
shows a comparison of convergence rates for
populations of 3, 5 and 7 individuals. It seems clear that 5 individuals is
the best. This result agrees with Carroll's who employed micro-GAs to optimize
an engineering problem Carroll (1996). The bottom panels show a comparison of
convergence rates for populations of 5
individuals and crossover rates of 0.7, 0.9 and 1.0. It seems that 0.9 is the
best crossover rate, although further tests showed that 0.95 gave even better
results and therefore that value was chosen for the remaining tests.
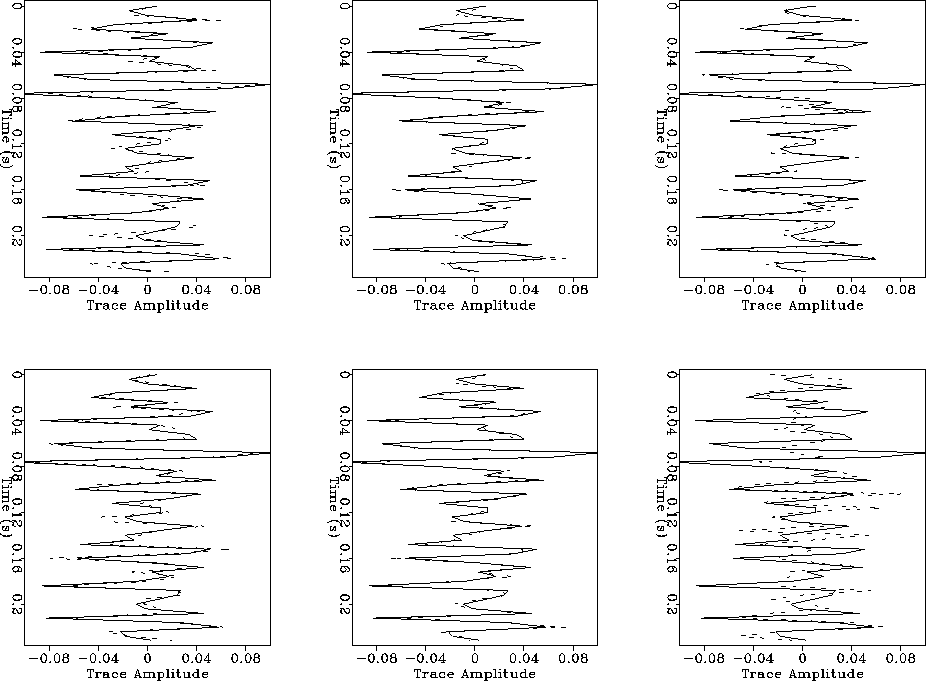
Figure ![[*]](http://sepwww.stanford.edu/latex2html/cross_ref_motif.gif) shows the results in terms of trace match. Again,
it is apparent that a population of 5 and a crossover rate of 0.9 are optimum.
In particular, note how a uniform crossover of 1.0 (bottom right panel) is
far too disruptive.
MG_compare1
shows the results in terms of trace match. Again,
it is apparent that a population of 5 and a crossover rate of 0.9 are optimum.
In particular, note how a uniform crossover of 1.0 (bottom right panel) is
far too disruptive.
MG_compare1
Figure 9 Comparison of convergence rates for
different options of the micro genetic algorithm. Top panel population rates
of 3, 5 and 7 (from left to right). Bottom panels, with population size of 5
and crossover rate of 0.7, 0.9 and 1.0.


 MG_compare2
Figure 10 Comparison of trace match for
different options of the micro genetic algorithm. Continuous line is the
reference trace and dotted line is the inverted trace. Top panel population
rates of 3, 5 and 7 (from left to right). Bottom panels, with population size
of 5 and crossover rate of 0.7, 0.9 and 1.0.


Next: Summary of Evolution Parameters
Up: Micro-Genetic Algorithm
Previous: Micro-Genetic Algorithm
Stanford Exploration Project
11/11/2002

![[*]](http://sepwww.stanford.edu/latex2html/cross_ref_motif.gif) shows a comparison of convergence rates for
populations of 3, 5 and 7 individuals. It seems clear that 5 individuals is
the best. This result agrees with Carroll's who employed micro-GAs to optimize
an engineering problem Carroll (1996). The bottom panels show a comparison of
convergence rates for populations of 5
individuals and crossover rates of 0.7, 0.9 and 1.0. It seems that 0.9 is the
best crossover rate, although further tests showed that 0.95 gave even better
results and therefore that value was chosen for the remaining tests.
Figure
shows a comparison of convergence rates for
populations of 3, 5 and 7 individuals. It seems clear that 5 individuals is
the best. This result agrees with Carroll's who employed micro-GAs to optimize
an engineering problem Carroll (1996). The bottom panels show a comparison of
convergence rates for populations of 5
individuals and crossover rates of 0.7, 0.9 and 1.0. It seems that 0.9 is the
best crossover rate, although further tests showed that 0.95 gave even better
results and therefore that value was chosen for the remaining tests.
Figure ![[*]](http://sepwww.stanford.edu/latex2html/cross_ref_motif.gif) shows the results in terms of trace match. Again,
it is apparent that a population of 5 and a crossover rate of 0.9 are optimum.
In particular, note how a uniform crossover of 1.0 (bottom right panel) is
far too disruptive.
shows the results in terms of trace match. Again,
it is apparent that a population of 5 and a crossover rate of 0.9 are optimum.
In particular, note how a uniform crossover of 1.0 (bottom right panel) is
far too disruptive.

