

Next: Extracting Lags
Up: Lomask: Fault contours
Previous: Introduction
Knowing the slip distribution has numerous applications, researchers
studying fault mechanics are already familiar with some of these uses.
However, it is quite likely that fault slip distribution information has been,
in general, under utilized by seismic interpreters and processors.
Hopefully, having fault contours automatically calculated will easily
integrate them into interpretation and processing workflows.
- Stresses and Rock Strengths
-
First of all, one can speculate about the interplay of rock strengths
and stresses.
The contours are a vital input for researchers studying fault mechanics.
They help unravel the stress and strain fields.
Understanding the slip distribution can imply slip and position of
neighboring faults.
- Seals
- One can use fault contours to see where the mininum displacement
should be to insure an adequate seal.
For instance, if the thickness of a sand reservoir is known,
then you will likely have a shale on sand seal if the displacement
is greater than the thickness.
In addition, in building a reservoir model, faults which have
insignificant displacement would not necessarily be included.
- Geological interpretation
- Combining the contours with other data can help unravel the geological
history by revealing periods of growth along the faults in the case of
syndepositional faulting.
Periods of rapid fault growth can be a result of increased sediment
loading that can be tied to mountain building events, eustatic
fluctuations, and climate changes.
- Well-ties in 3D modeling
- The slip from a fault contour can be backinterpolated at well locations.
In the case of normal faulting, the magnitude of the slip can be compared
with the missing section from the wells.
In the case of reverse faulting, it can be compared with the repeat section.
This information can be incorporated as an additional well tie and
input into 3D models.
- Automatic horizon interpretation
- If the slip distribution is known for an entire volume of 3D seismic data,
then the faults can be removed.
Once they are removed, then auto-interpretation procedures can be used
to interpret the horizons with ease.
- Constrain processing
- By tying with the regional stress field, likely faulting strike,
dip and magnitude can be estimated.
This has potential to help constrain velocity analysis.
In addition, fault displacement information from well data can be used
as constraints.
- Missing section information used in standard fault interpretation
- Knowing the fault displacement can be incorporated into an
interpretation program to help correlate faults.
Faults are typically interpreted by an interpreter digitizing fault
segments, then correlating the appropriate segments with particular
faults, and triangulating fault surfaces.
If the slip distribution was calculated on that triangulated fault surface,
the interpreter can take advantage of certain fault behavior rules to
correlate and measure the quality of the correlation.
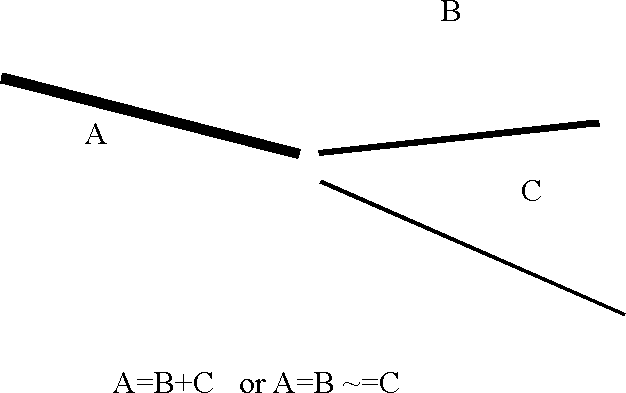
faultgap
Figure 2 Fault Gaps

Figure 2 is a cartoon of a mapview of fault gaps.
Fault gaps are mapview representations of missing sections where
normal faulting has caused the horizon to separate.
When three fault breaks come together, it is often unclear whether
one fault split into two or two different faults just pass closely
to each other.
In the first case, the missing section on fault A will equal the
sum of missing sections on faults B and C.
In the second case, perhaps A and B are one fault and C is a
separate fault; therefore, the missing section on A will equal B
and not equal C.


Next: Extracting Lags
Up: Lomask: Fault contours
Previous: Introduction
Stanford Exploration Project
6/8/2002
