

Next: Poststack land data multiple
Up: Attenuation of internal multiples
Previous: Adaptive filtering with non-stationary
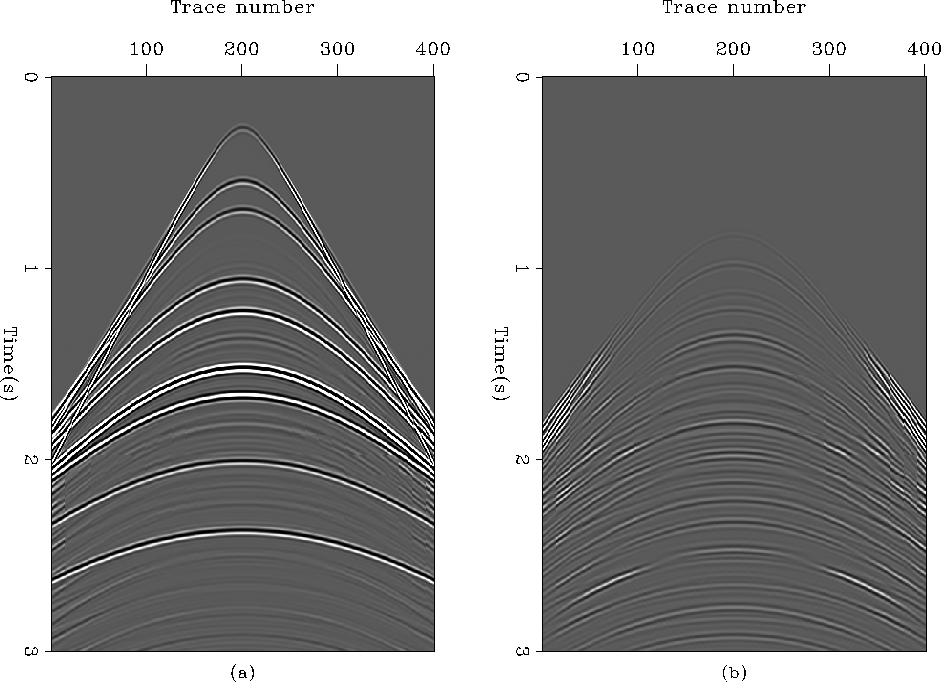
Figure 8a shows the estimated primaries when the  -norm
is used to compute the shaping filters. Figure 8b displays
the estimated internal multiples. As expected, because of the amplitude
differences between the signal (primaries) and the noise (multiples), the
adaptive subtraction fails and we retrieve the behavior explained in the preceding
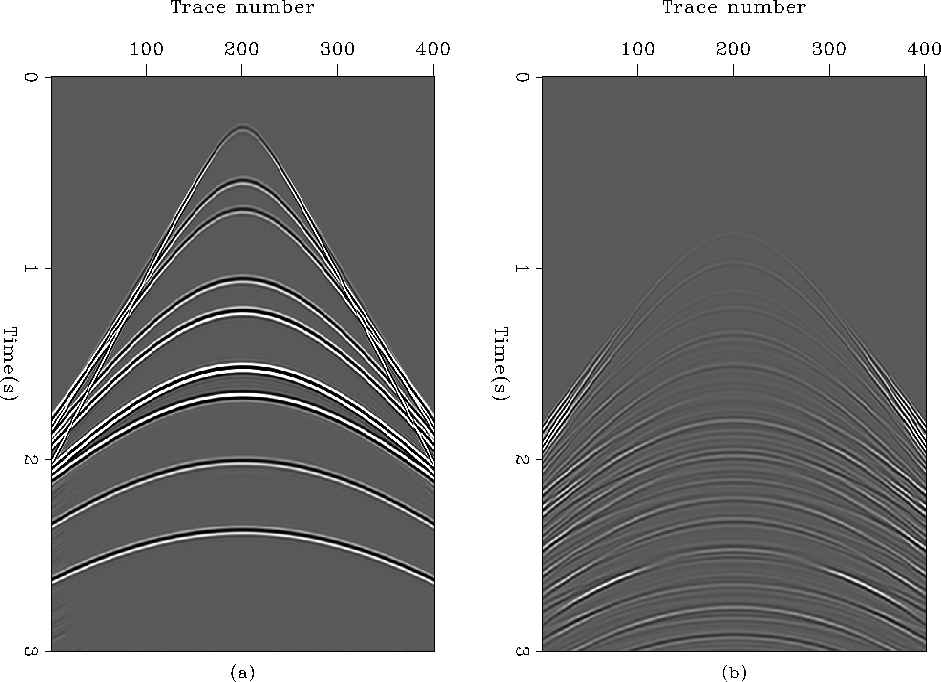
section with the 1D example. Now, in Figure 9, we see the
beneficial effects of the
  -norm. Figure 9a shows
the estimated primaries and Figure 9b the estimated
multiples. The noise subtracted almost perfectly matches the
internal multiple model in Figure 6b, as anticipated.
interl2
Figure 8 (a) The estimated primaries
with the  -norm. (b) The estimated internal multiples with the
 -norm. Ideally, (b) should look like Figure 6b,
but it does not.


 interl1
Figure 9 (a) The estimated primaries
with the  -norm. (b) The estimated internal multiples with the
 -norm. Beside some edge-effects, (b) resembles
closely Figure 6b. The adaptive subtraction worked
very well.


Next: Poststack land data multiple
Up: Attenuation of internal multiples
Previous: Adaptive filtering with non-stationary
Stanford Exploration Project
6/7/2002


