 |
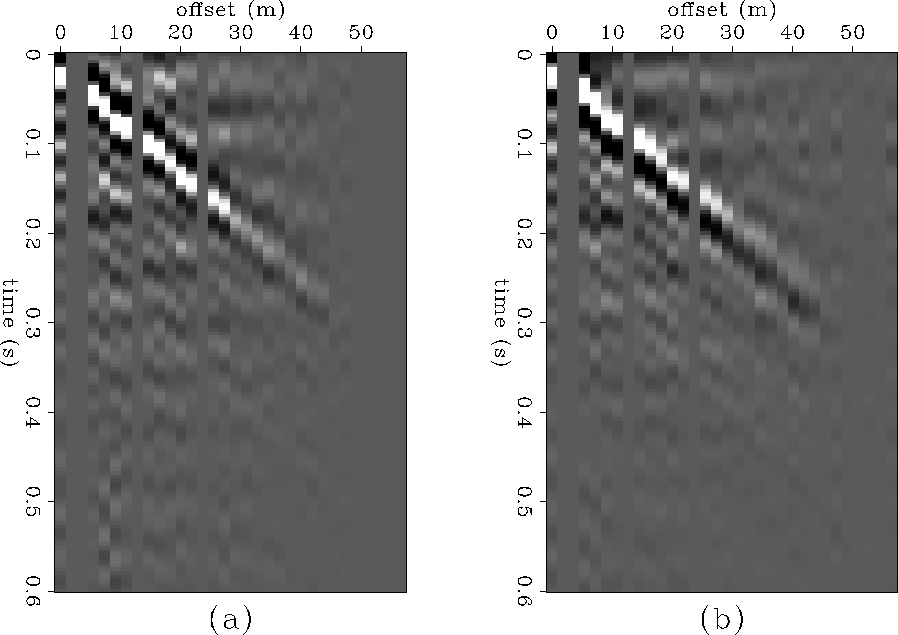
Figure 8 Impulse response calculated by (a) 3-D autocorrelation, and (b) spectral factorization. Compare with Figure
![[*]](http://sepwww.stanford.edu/latex2html/cross_ref_motif.gif) .
.
![[*]](http://sepwww.stanford.edu/latex2html/movie.gif)
![[*]](http://sepwww.stanford.edu/latex2html/cross_ref_motif.gif) shows the impulse reponses derived by
autocorrelation and spectral factorization of about 95 minutes of
passive data. The rest of the passive data contained significant
coherent noise below 30 Hz, which caused degraded results.
shows the impulse reponses derived by
autocorrelation and spectral factorization of about 95 minutes of
passive data. The rest of the passive data contained significant
coherent noise below 30 Hz, which caused degraded results.
From the results presented here, it is not clear that any reflection events are present in the data. However, both the autocorrelation and spectral factorization result do resemble active source seismograms. The slightly dispersive ground-roll cone is clearly visible with a velocity of about 150 m/s.
 |
![[*]](http://sepwww.stanford.edu/latex2html/cross_ref_motif.gif) .
.
![[*]](http://sepwww.stanford.edu/latex2html/movie.gif)