|
|
|
|
Decon comparisons between Burg and conjugate-gradient methods |
 gain correction.
One power of
gain correction.
One power of  is a geometrical divergence correction.
The other power of
is the expected loss of bandwidth
propagating through a constant-
is a geometrical divergence correction.
The other power of
is the expected loss of bandwidth
propagating through a constant- medium.
Not wanting to study the end-effect differences between the two methods
(as they are already well defined by theory)
we taper both ends of each seismogram to zero.
medium.
Not wanting to study the end-effect differences between the two methods
(as they are already well defined by theory)
we taper both ends of each seismogram to zero.
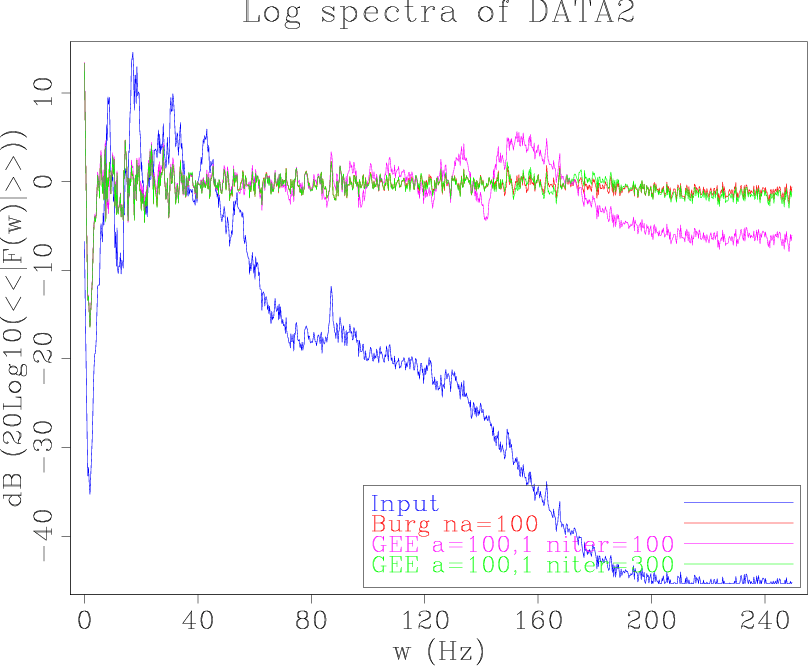
We compute the spectrum of each data set in the usual way. We average the energy spectrum of each trace, then take the logarithm of the average, and finally shift the logarithm as a function of frequency to be zero at 40Hz.
|
|---|
|
DeconLogFourier-DATA2
Figure 1. The log spectrum of the the Kjartansson data set and decon outputs by the three different methods. The wide ranging spectrum is that of the input data. The two near constant spectra are the Burg and the ``triply iterated'' CG decon outputs. By triply iterated we mean 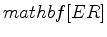 the number of iterations theoretically required.
The ``not-so-near-constant'' curve arises from
CD with the theoretically needed iterations,
namely, as many as the filter coefficients.
This curve seems to resist the theoretical requirement
to boost very low and very high frequencies
(which in practice might not be a bad idea!).
the number of iterations theoretically required.
The ``not-so-near-constant'' curve arises from
CD with the theoretically needed iterations,
namely, as many as the filter coefficients.
This curve seems to resist the theoretical requirement
to boost very low and very high frequencies
(which in practice might not be a bad idea!).
|
|
|
|
|---|
|
Decon-DATA2
Figure 2. Left is a portion of the Kjartansson data set. Right is its Burg decon. Outputs of the CG Pef were on paper indistinguishable from Burg decon, but slightly distinguishable when alternately blinking on a screen. |
|
|
|
|---|
|
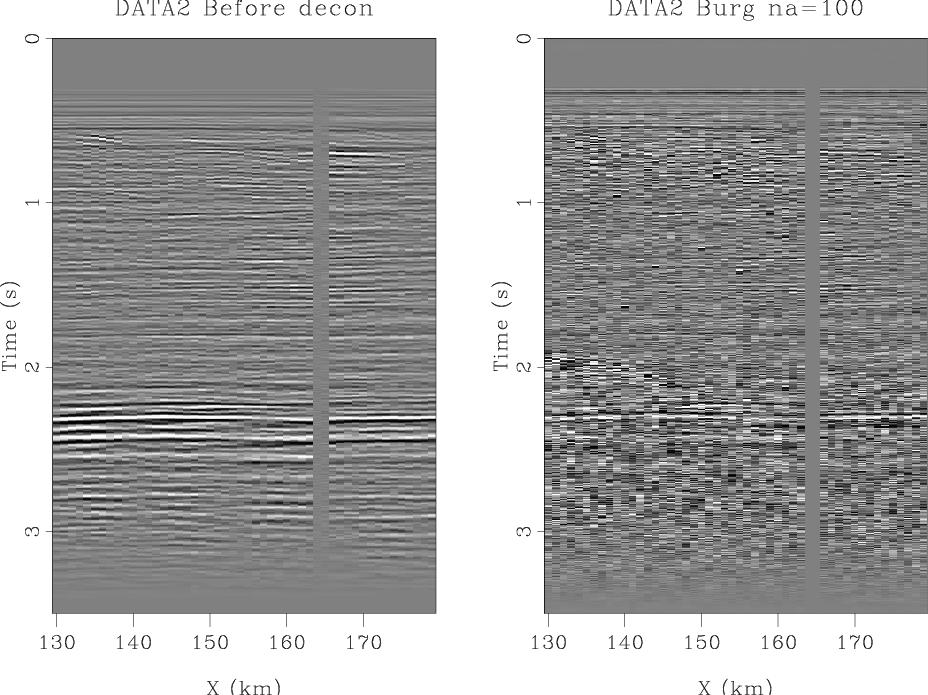
Decon-DATA6
Figure 3. The Gulf of California data set. Unwelcome near-zero frequencies appear from trace to trace. These appeared with all decon methods. Apparent precursors to the water bottom are PDF document artifacts. |
|
|
|
|---|
|
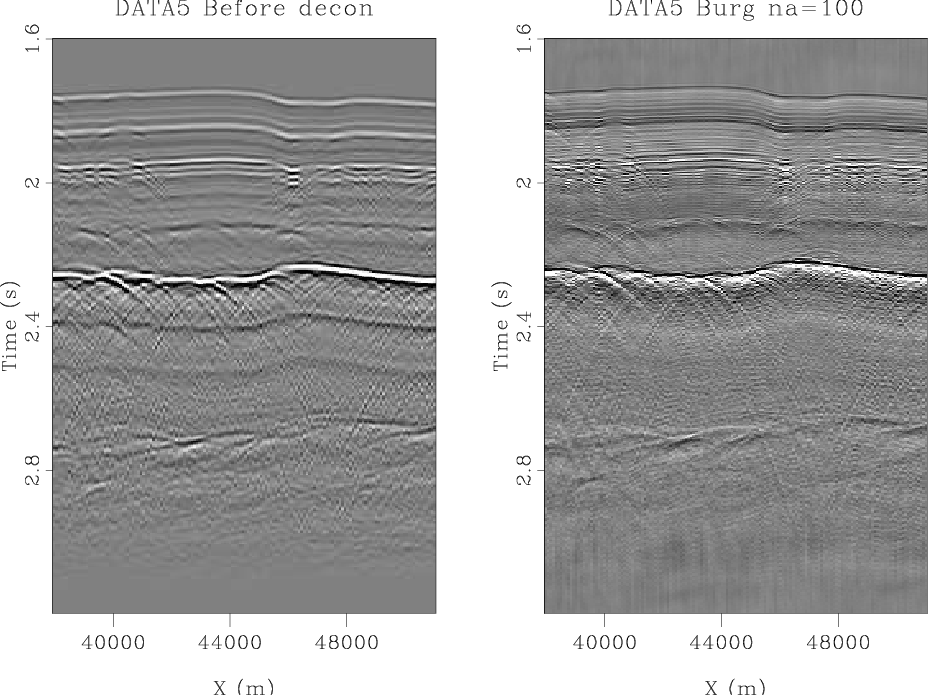
Decon-DATA5
Figure 4. Gulf of Mexico data set. Suspicious low frequencies are strongest following the top of salt reflector at 2.3s but visible throughout the data. Seems likely someone filtered this data before it came to us. |
|
|
|
|
|
|
Decon comparisons between Burg and conjugate-gradient methods |