Next: DATA RESTORATION
Up: Multidimensional deconvolution examples
Previous: Multidimensional deconvolution examples
This chapter shows many examples to give some feeling
for multidimensional spectra, deconvolution, and modeling.
In each of Figures
2-7
we see three panels.
The left panel is a two-dimensional data set
which is an image of something that might be familiar.
Let this data d(x,y) have Fourier Transform
D(kx,ky).
Define noise n(x,y) to be a plane of random numbers.
In Fourier space,
these numbers are
N(kx,ky).
Now compute an amplitude spectrum by smoothing
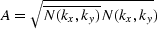 .Using this noise we compute the synthetic data in the center frame.
It has the 2-D spectrum
.Using this noise we compute the synthetic data in the center frame.
It has the 2-D spectrum  which is the same 2-D
amplitude
spectrum of the given data
but a different
phase
spectrum.
which is the same 2-D
amplitude
spectrum of the given data
but a different
phase
spectrum.
For each illustration, notice the similarities
and differences between the real data and the synthetic data.
The rightmost frame has Fourier Transform D/A,
the original data with its spectrum divided out.
What we see is called ``deconvolved data''.
It is also called ``prediction error''.
Theoretically, its output is ``white''.
Actually its spectrum is only approximately white
because the spectrum is smoothed before it is
divided out.
(The name prediction error derives from a simple model
that can be applied to all data. This simple model
is that all data can be modeled as white noise into a filter
where the filter has a spectrum that is a smoothed version
of that of the data.)
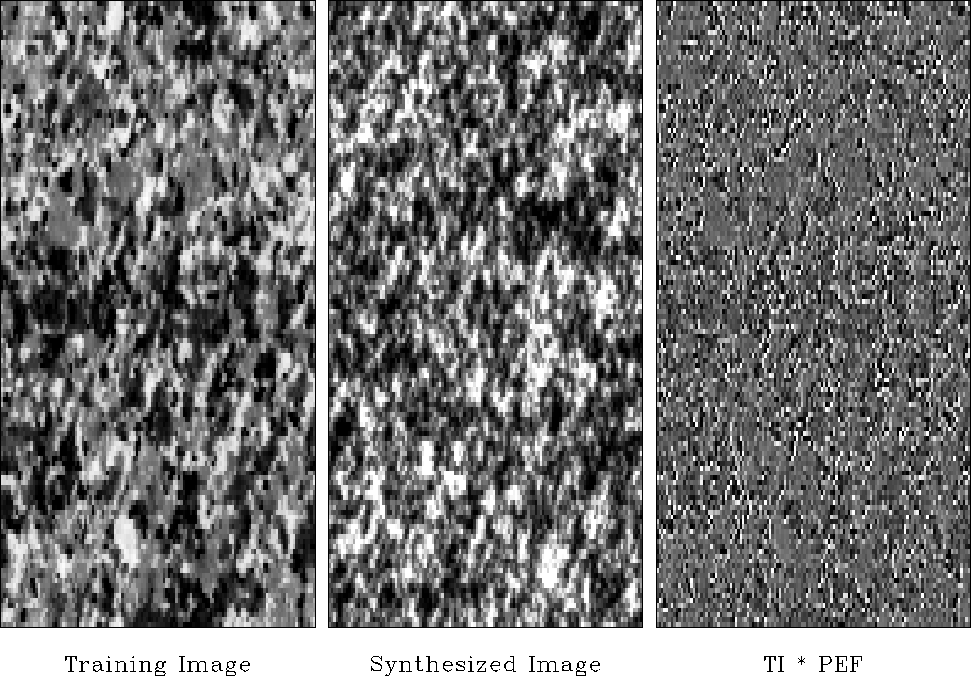
granite
Figure 1
Synthetic granite matches the training image quite well.
The prediction error is large at crystal grain boundaries
and almost seems to outline the grains.

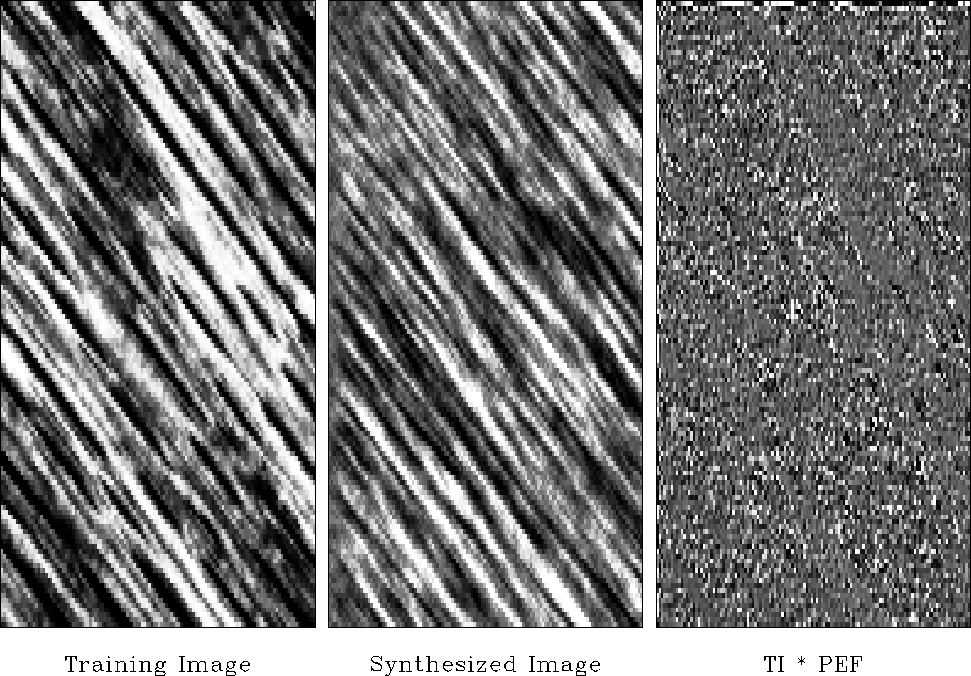
wood
Figure 2
Synthetic wood grain has too little white.
This is because of the nonsymmetric brightness histogram of natural wood.
Again, the deconvolution looks random as expected.
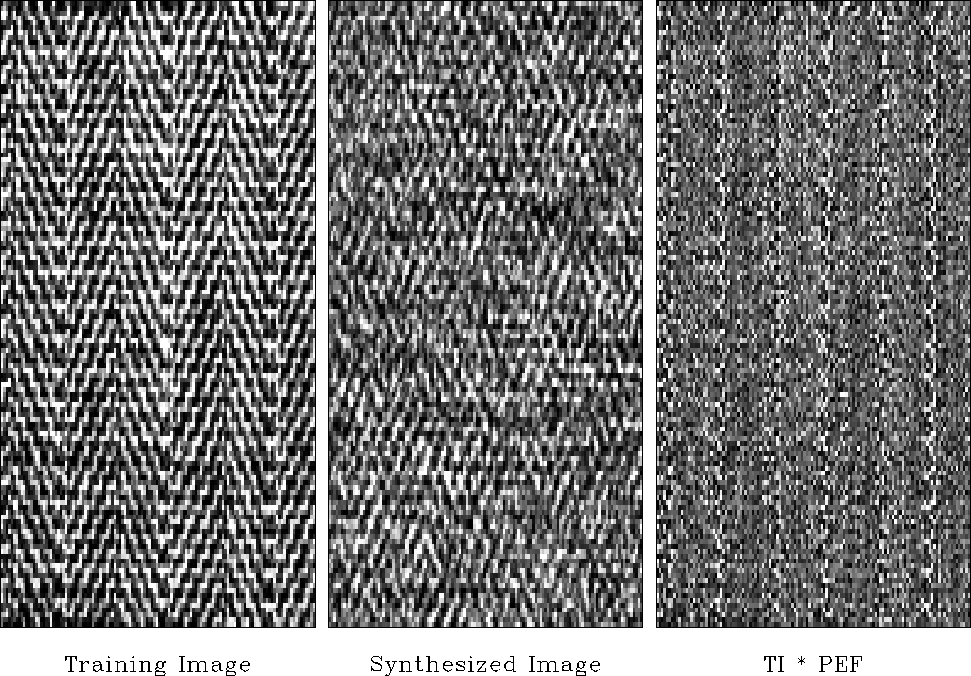
herr
Figure 3
A banker's suit (left). A student's suit (center). My suit (right).
The deconvolution is large where the weave changes direction
(herring bone spine).
basket
Figure 4
Basket weave.
The synthetic data fails to segregate the two dips into a checkerboard pattern.
The deconvolution looks structured.
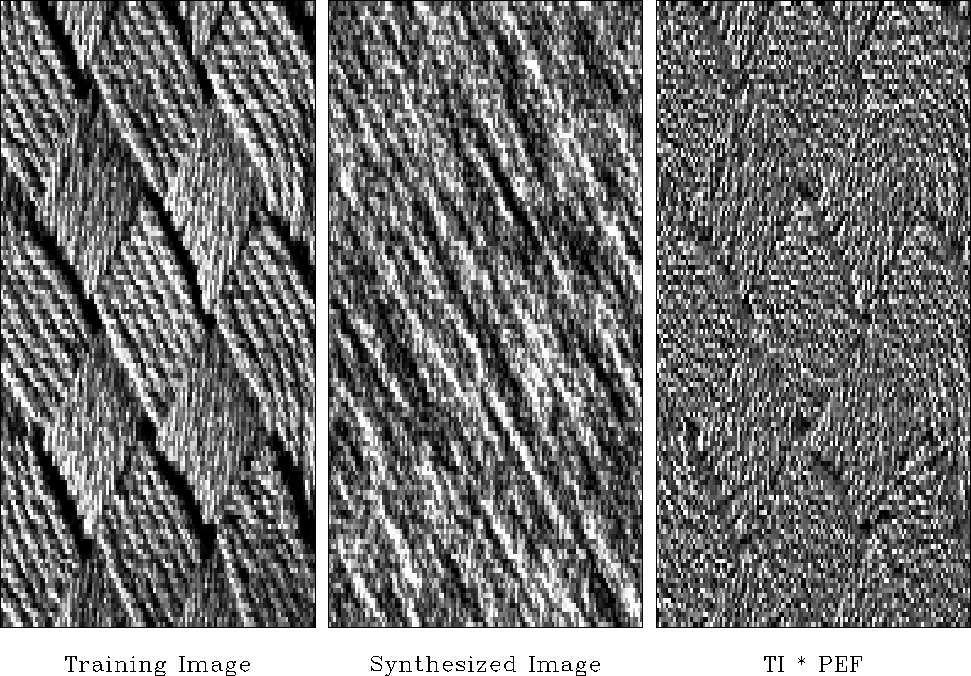
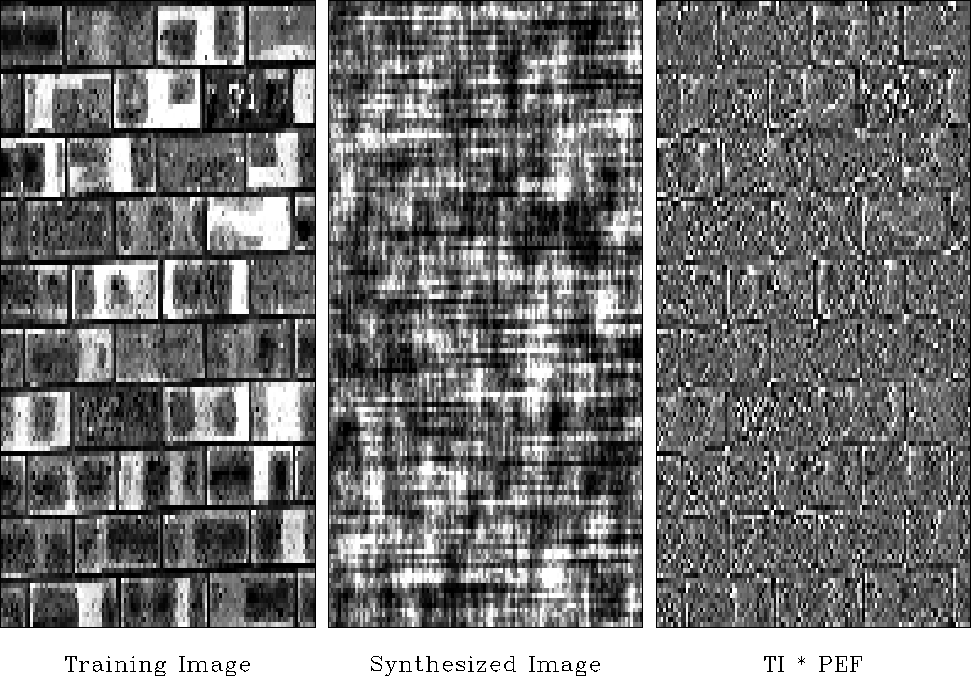
brick
Figure 5
Brick.
Synthetic brick edges are everywhere
and do not enclose blocks containing a fixed color.
PEF output highlights the mortar.
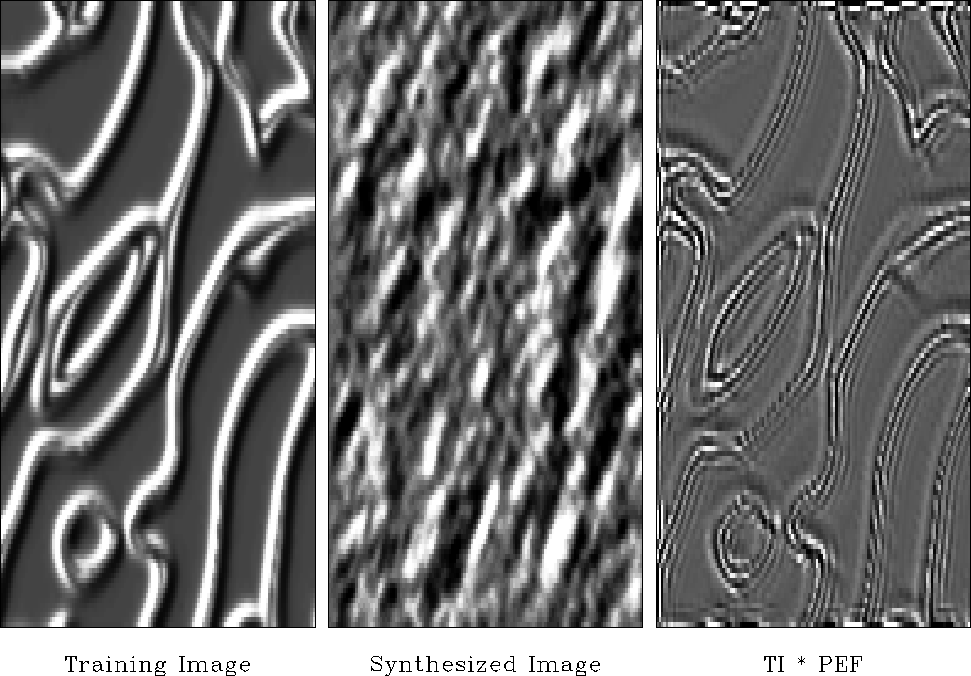
ridges
Figure 6
Ridges.
A spectacular failure of the stationarity assumption.
All dips are present but in different locations.
The ridges have been sharpened by the deconvolution.
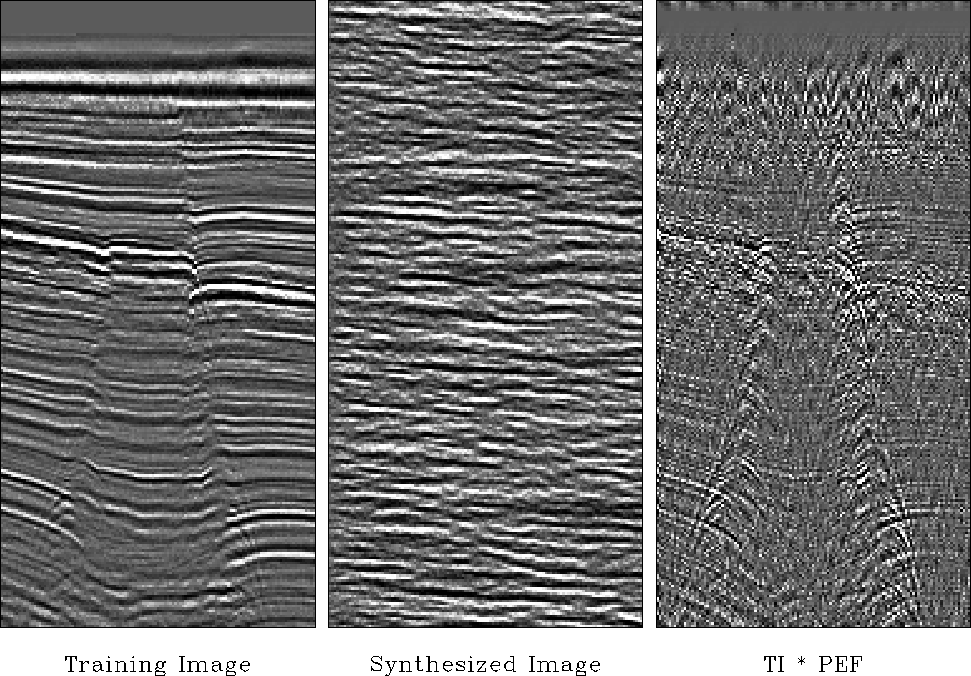
WGstack
Figure 7
Gulf of Mexico seismic section, modeled, and deconvolved.
Do you see any drilling prospects in the synthetic data?
The deconvolution suppresses the strong horizontal
layering giving a better view of the hyperbolas.
Next: DATA RESTORATION
Up: Multidimensional deconvolution examples
Previous: Multidimensional deconvolution examples
Stanford Exploration Project
3/1/2001