
![]()

![]()

![]()
![]()
|
|
.
.
.
.
.
.
.
.
.
.
.
.
.
.
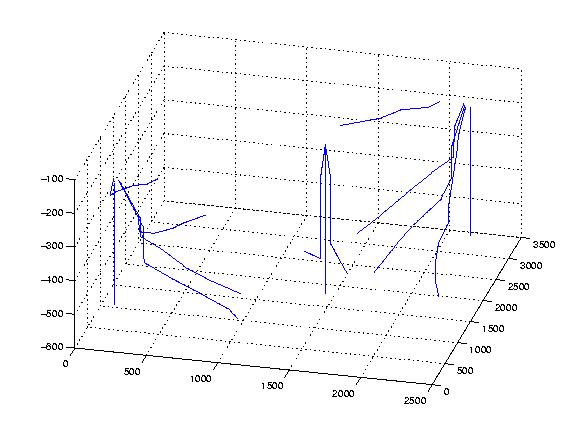
These shots are from my paper in SEP 105. It shows a porisity model (left) and a P-wave velocity model (right). These were sampled from well trajectories in the Stanford V data set (below). The well data was interpolated into a cube using an ordinary kriging algorithm. P-wave velocity, S-wave velocity, and density were used in an elastic modeling program to generate synthetic shot gathers..
.
.
.
Using Gassman's equations for fluid substitution, the original brine saturated model was changed to gas in the porous sand body (located between 1500m and 2500m at a depth of 150m-200m). This substitution yields the characteristic increase in amplitude and AVO effect as seen in the movie below. These CMP gathers were taken from a distance of 2000m in the model. Note the increased amplitude in the reflector from the top and bottom of the sand body, as well as the very apparent change in polarity in the bottom reflector in the gas substituted CMP gather..
.
|
Stanford University Geophysics Department |

|