|
zeroFoltXPefLN
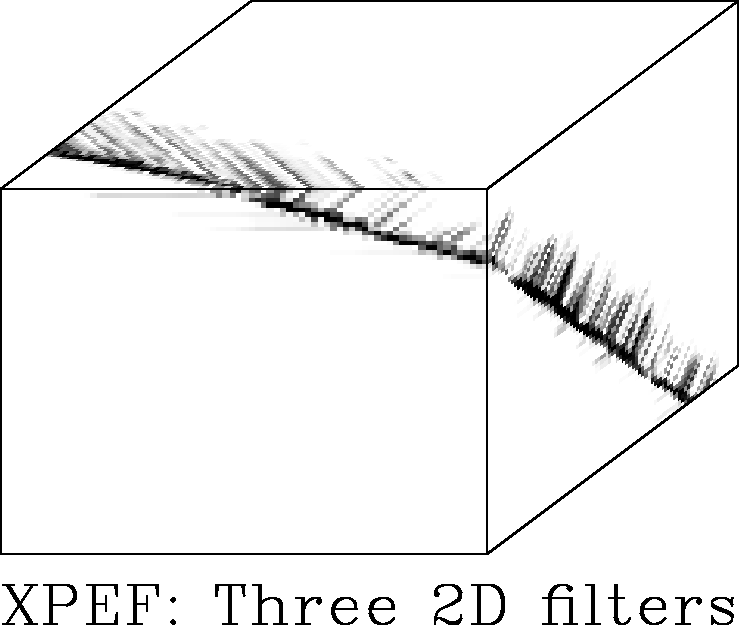
Figure 41 Magnitude of three 2-D prediction error of synthetic image. The fault is broadly outlined by patches of considerable prediction error. |  |
Figure 41 shows that the norm of the three prediction errors broadly delineates the fault in the synthetic case. Again the patches that contain the discontinuity show large prediction errors.
|
zeroFoltXPefLN
Figure 41 Magnitude of three 2-D prediction error of synthetic image. The fault is broadly outlined by patches of considerable prediction error. |  |
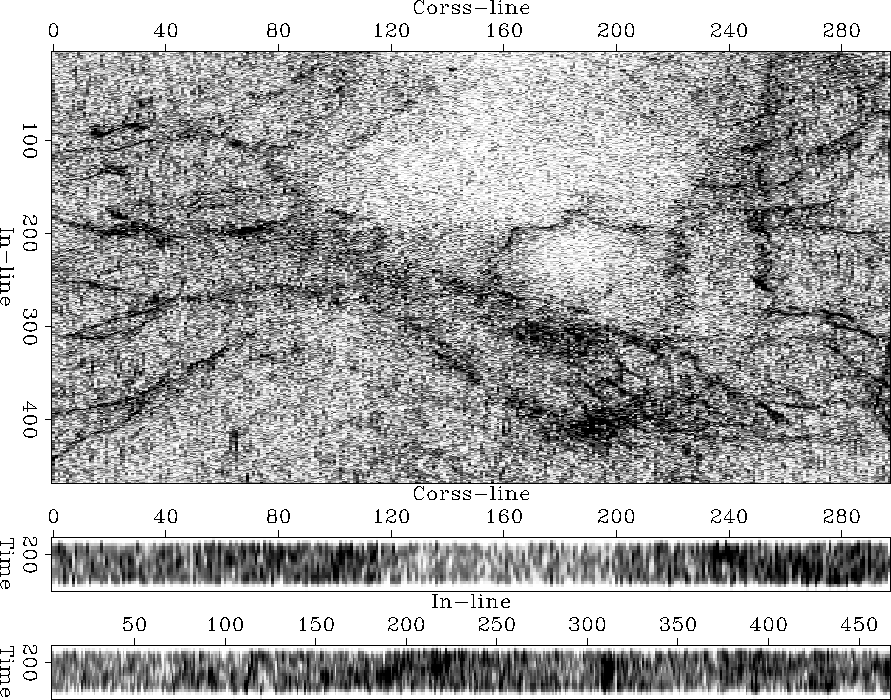
The seismic test image of the Gulf salt dome indicates major fault lines as fuzzy zones of heightened prediction error (Figure 42). However, the overall image is noisy and the discontinuities are not pinpointed nor well contrasted from their surroundings. The sedimentary layering is completely suppressed. The salt gives rise to a region of low but noisy prediction error. Half of the pentagonoid region within the salt is clearly delineated; the other half is not. Additionally, the prediction-error attribute reveals a few features of the salt boundary that were obscured in other attribute images. For example, the long north-south fault at the eastern edge of the image. The North Sea horst image (not shown) similarly hints at its faults without differentiating and resolving them sufficiently. The three two-dimensional prediction error does not yield a convenient discontinuity image.
 |