

Next: Backprojection of residual
Up: Norm of residual
Previous: Norm of residual
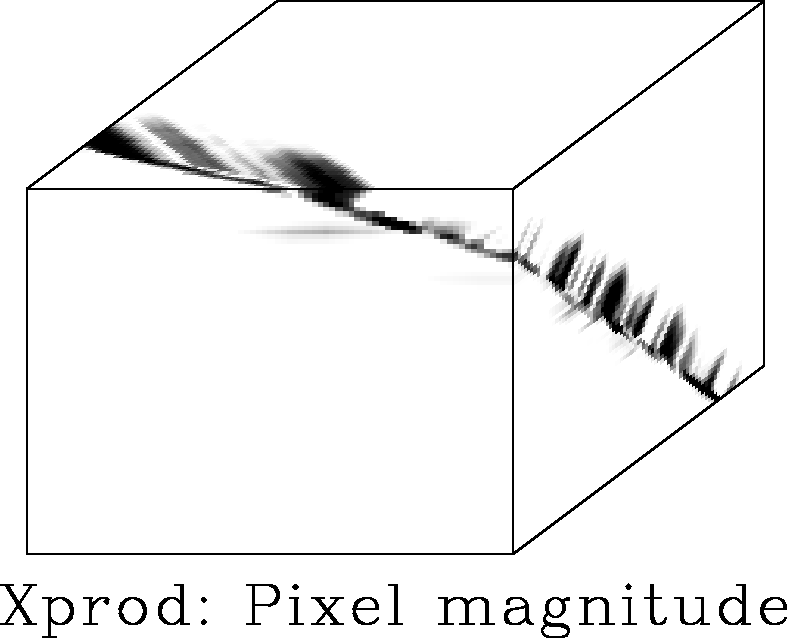
The magnitude of the residuals of the synthetic image example
(Figure 26)
resembles its constituent components
(Figure 25).
Patches that contain pure plane waves are zeroed.
Patches that straddle the fault and contain two plane waves of
distinct dip show significant residual amplitudes.
The limit of resolution of the operator is the patch and, again,
the fault is broadly outlined but not pinpointed.
The discontinuity amplitude does not have a simple interpretation,
except that it indicates plane-wave elements that are not well
approximated by the somewhat arbitrary best-fitting local plane wave.
Interestingly,
the generally lower amplitudes of the horizontal plane-wave region
indicate that the the best-fitting local plane waves tend to approximate
the horizontal events better than the dipping ones.
The side of the local cubic patch is 12 pixels long;
the side of the total input cube is 80 pixels long.
zeroFoltDXGLN
Figure 26
Pixel magnitude of cross-product residual of the synthetic image.
The pixel magnitude of the cross-product residual of
Figure 25
roughly delineates the fault of the input image.
Again,
instead of pinpointing the fault,
the operator highlights any local patch
that violates the plane-wave assumption.
|
|  |


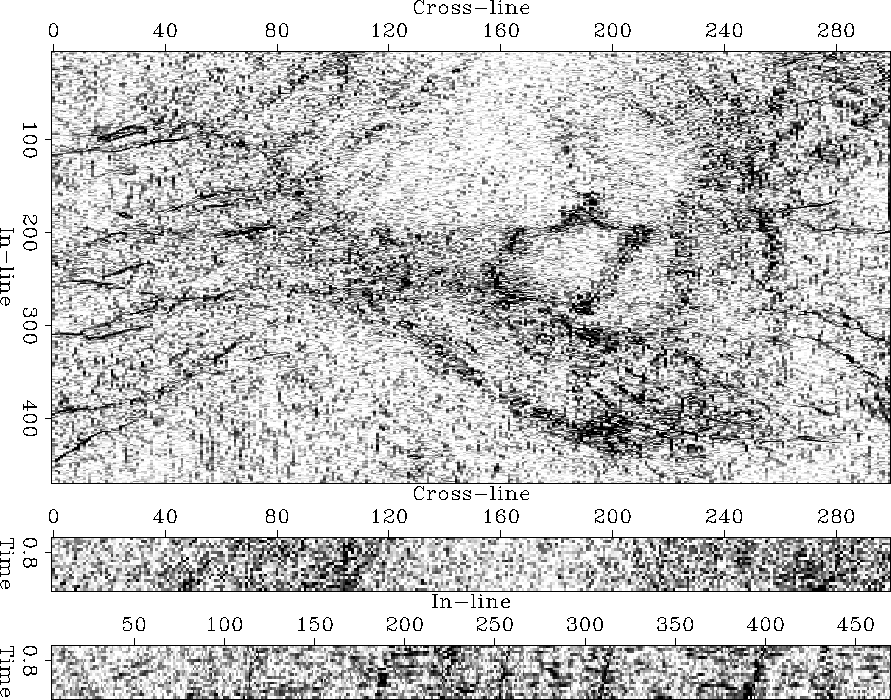
Applied to the Gulf salt dome image
(Figure 27),
the magnitude of the crossproduct operator
generates
a noisy discontinuity map
that is void of sedimentary layers
but only hints at the image's faults.
The attribute suppresses the sedimentary layers successfully,
even the steeply dipping ones in the north-west corner.
The radiating faults
(e.g., the one marked Rin the original image 8)
are depicted as linear features of high discontinuity amplitude.
However, the image's general random noise obscures its faults.
The internal area of the salt body
does not generate high amplitudes.
The pentagonoid region within the salt,
the diagonally truncating fault,
and the salt-sediment boundary
are broadly outlined by a fuzzy zone of high discontinuity.
gulfFoltTotDXGLN
Figure 27
Pixel magnitude of cross-product residual of the Gulf salt image.
The noisy discontinuity map successfully suppresses the original
wavefield character and fuzzily indicates the image's faults.


The interpretability of
the image features
suffers from its high noise-to-signal ratio that spoils its
contrast and sharpness.
The resolution of the radial faults is again the size of the patches.
Moderate temporal smoothing might slightly improve the image
without loss of resolution.
In the case of the North Sea horst image (not shown),
the randomness of the time slice
defeats interpretation, even though a few linear features are discernible.
Disappointingly, the vertical section of the
North Sea horst image depict traces of sedimentary layers.
In summary,
the magnitude of the cross-product residual
failed to compute an interpretable discontinuity map.


Next: Backprojection of residual
Up: Norm of residual
Previous: Norm of residual
Stanford Exploration Project
3/8/1999

