|
zeroFoltCor
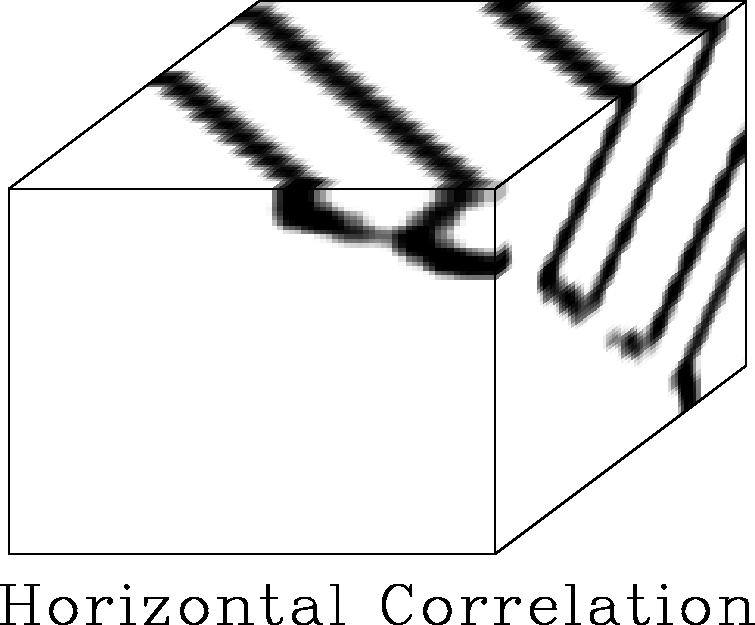
Figure 22 Horizontal correlator applied to synthetic test case. The correlation of neighboring trace intervals annihilates the horizontal beds but fails to reject the dipping ones. Hence, the fault is not well isolated. |  |
|
zeroFoltCor
Figure 22 Horizontal correlator applied to synthetic test case. The correlation of neighboring trace intervals annihilates the horizontal beds but fails to reject the dipping ones. Hence, the fault is not well isolated. |  |
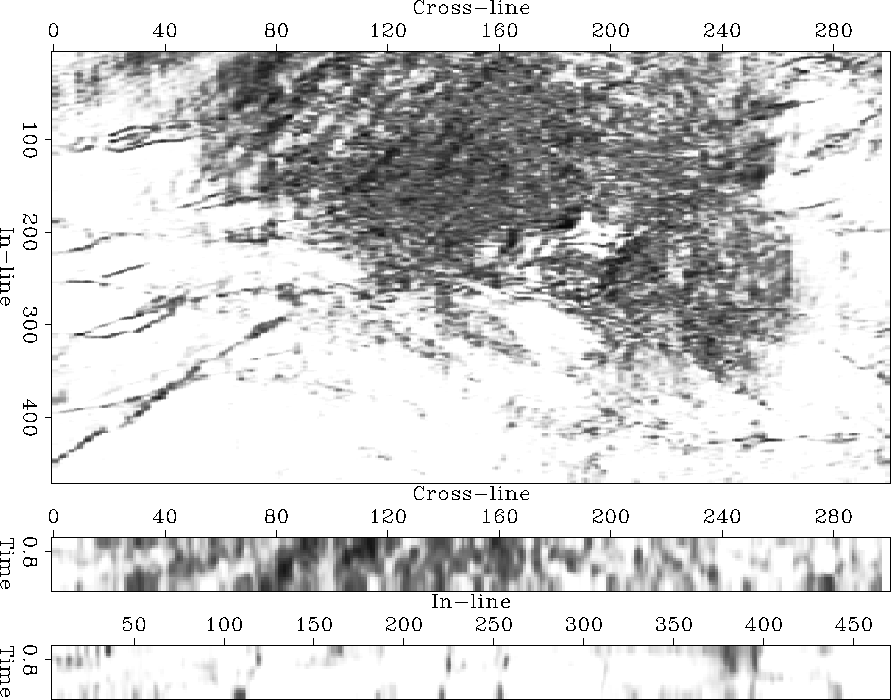
Horizontal correlation is a surprisingly successful discontinuity attribute when applied to seismic subsurface images. Applied to the Gulf salt dome image (Figure 23), the correlation successfully suppresses the horizontal layers. Even dipping layers are removed, if laterally they smoothly vary, due to their width. However, high-frequency dipping layers, such as in the north-west corner, are not removed, but show a considerable discontinuity amplitude.
 |
The radiating faults are discerned. The fault marked R in the original seismic image 8 is depicted. An intrepid interpreter may even suspect that the fault diagonally crosses the salt body and reappears in the north-east corner of the time slice. The primary faults in the subsurface are accompanied by similar linear features with lower amplitude. These events might be fault surfaces that only partially intersect the local patch or that separate sedimentary layers of little local contrast. Overall, the faults contrast sharply with their surrounding image regions. The discontinuity map has about patch-sized resolution, as expected.
The salt itself gives rise to a region of little correlation and consequently high amplitude. Among the chaos of events, the salt truncating faults are not enhanced. The central pentagonoid region at the southern tip of the salt body mostly vanishes in the discontinuity map.
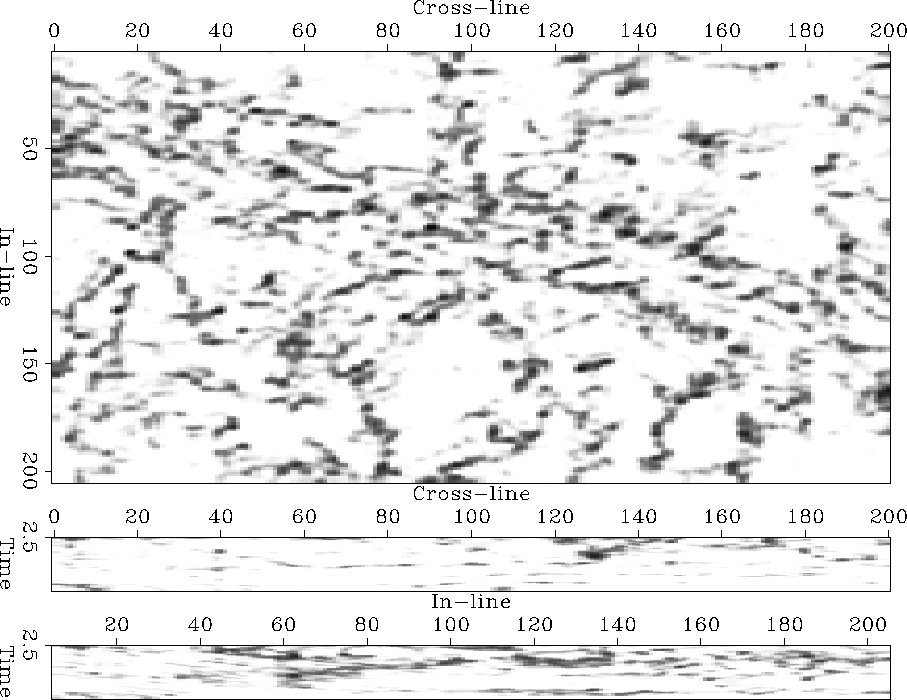
In the case of the North Sea horst image, the horizontal correlation reveals a complex set of linear discontinuity events. The sedimentary layers are removed in the time slice and the faults of the original image can be related to the faults in the attribute image. However, the attribute fault indicates additional discontinuities. Are these discontinuities significant for the image's geological interpretation?
 |
In Figure 24, the discontinuities contrast sharply with the surrounding sedimentary packages. However, the processes resolution is about the size of the correlation patches.
Horizontal correlation, as a semi-successful discontinuity attribute, emphasizes the importance of the within a time slice. The privileged role of the horizontal plane (and its derivatives or correlation) result from the common horizontal deposit of subsurface layers. deposited horizontally. The next section generalizes the horizontal correlation approach to images with sedimentary layers of any dip.