|
nseaFoltTotRawVol
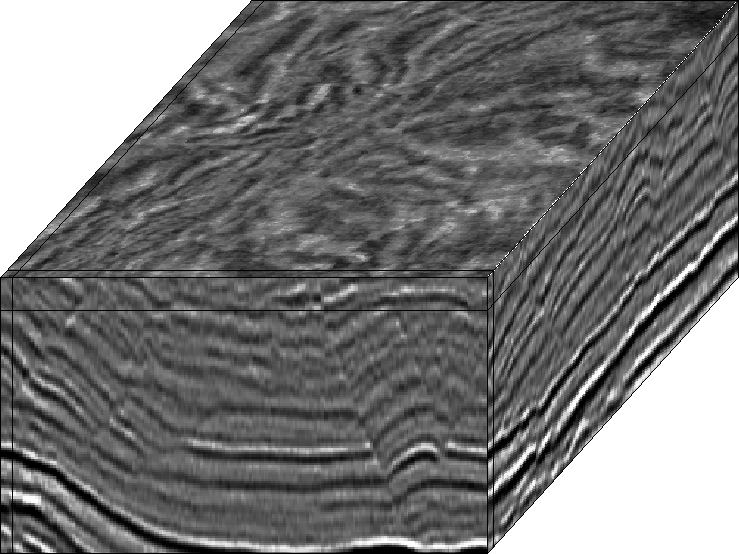
Figure 9 Volume view of North Sea horst. The Figure represents a volumetric view of the sections of the previous Figure 11. The mid-volume lines indicate the position of the extracted and displayed two-dimensional sections. |  |
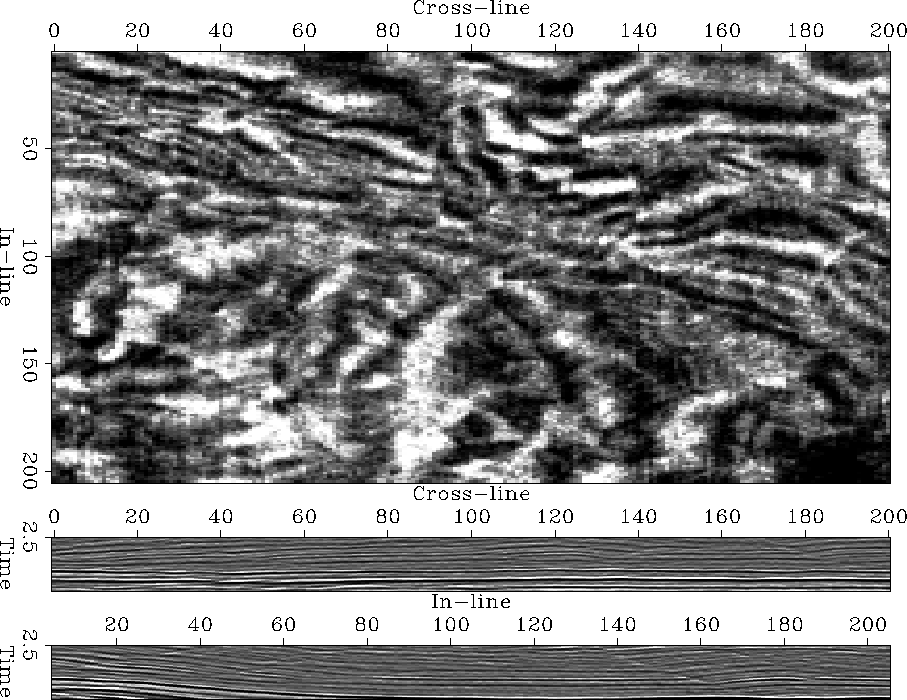
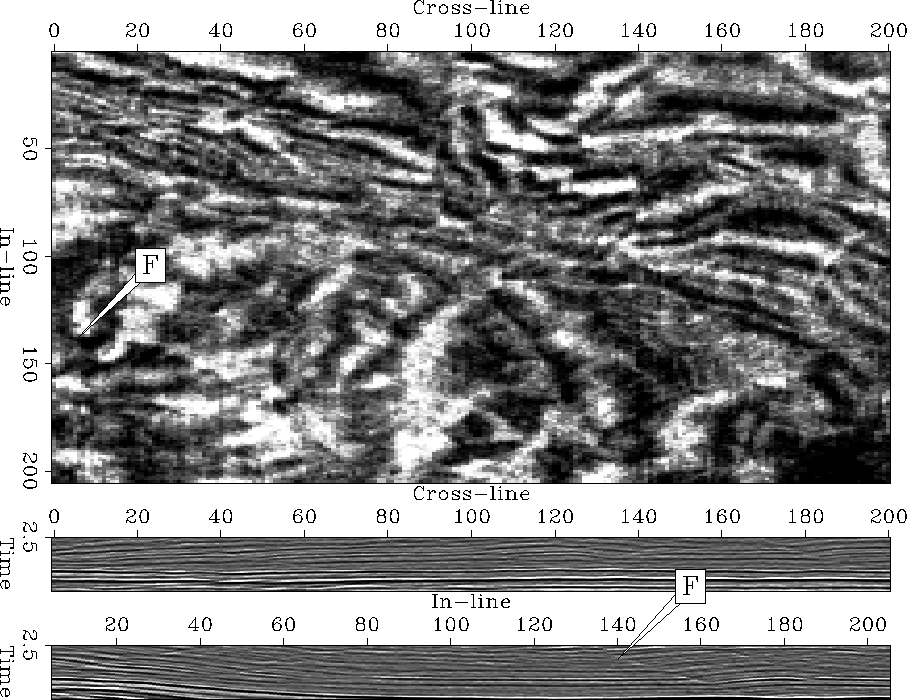
The second seismic test case, shown in Figure 9 depicts a fault-bounded North Sea horst structure. Figure 11 shows a plane view of the the selected time and vertical image slices.
|
nseaFoltTotRawVol
Figure 9 Volume view of North Sea horst. The Figure represents a volumetric view of the sections of the previous Figure 11. The mid-volume lines indicate the position of the extracted and displayed two-dimensional sections. |  |
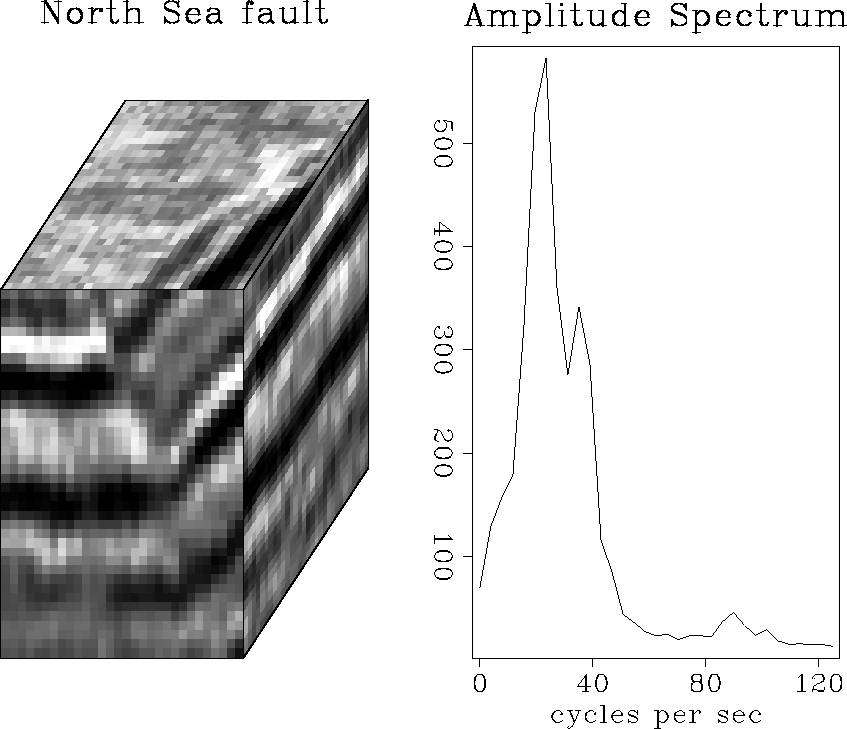
The vertical sections show sets of parallel listric faults that flank a complex horst structure. Except at the northern edge of the image, the sediments are nearly horizontal. The lower fault blocks are, however, slightly tilted, which undulates the upper sediments. In contrast to the vertical section's listric faults, the time slices' intricate zigzag and rhomboidal fault pattern is difficult to discern and indicates the three-dimensional complexity of the entire horst region. The vertical sections of Figure 11 show listric faults: their dip decreases with depth. However, the faults do not sharply cut the surrounding sediments but, rather, seem to interpolate between them. As illustrated in Figure 10, the images faults show a width of a few samples and their spatial frequency components do not show much energy above half-Nyquist.
 |
I expect a successful discontinuity map to delineate the complex fault pattern of the horst's time slice. Furthermore, I expect the sedimentary layers in the vertical sections to be removed. Bednar tested his discontinuity attribute at this image. To facilitate a comparison among this chapter's discontinuity attributes, I marked a major fault in Figure 11 with an F.
 |
 |