 |
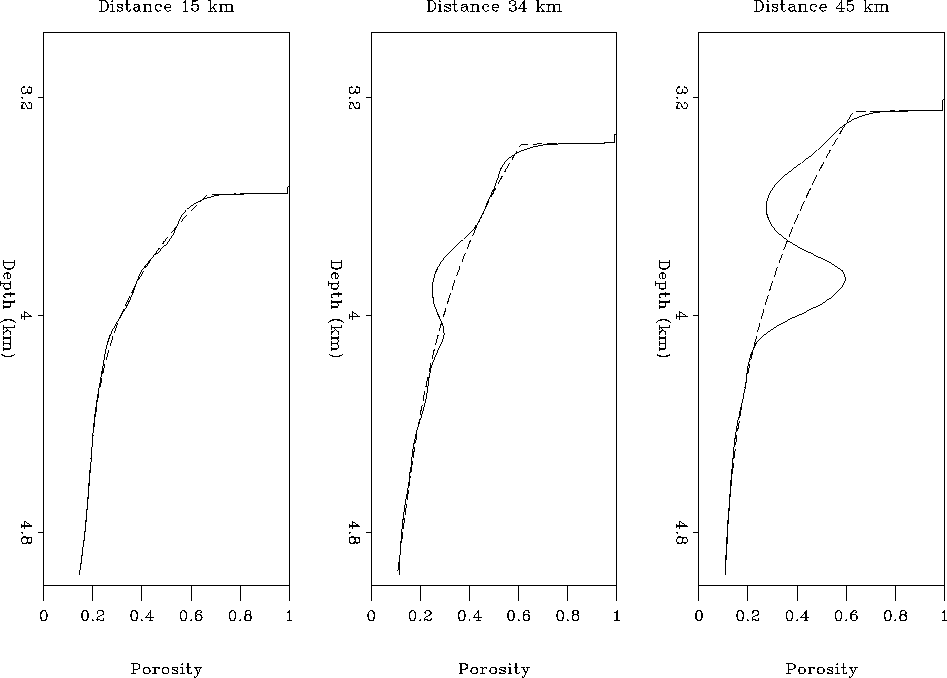
Figure 7 The baseline porosities (solid lines) are overlaying the fitted normal brine porosities.
In this section, we choose an alternative approach to determining the normal porosity trend. Instead of averaging the brine porosities and thus propagating errors in velocity or uniformness of the lithology, we obtain the normal porosities on a trace-by-trace basis. In this way, the normal trend is determined locally at each surface position by fitting polynomials to the near-surface and deep sediment baseline porosities. We thus exclude the anomalous porosities caused by the presence of hydrate and gas. The fitting was done using an iterative least-squares approach and third order polynomials. Figure 7 shows the baseline porosities overlain by the so determined fitted normal brine trends.
 |
As before, the first panel represents the porosities in an area without prominent BSR, thus probably indicating pure brine saturation of the sediments. Both porosity lines are in good agreement. The middle section shows how the normal porosity trend fits the upper most porosity and the deep sediment porosity well, leaving a clear hydrate anomaly. The third panel displays both a large hydrate and gas anomaly. In contrast to the averaging method (Figure 5), this approach yields considerably larger hydrate anomalies. At the end of the section, this method does, however, result in an overestimation of the hydrate residuals. This is caused by amplitude blanking in this region (Figure 1), which leads to an increasing absence of near-surface reflections. Consequently, the seismic velocities are determined solely from the seafloor and the BSR thus approaching the hydrate velocity in this region. This is mapped into the porosities which include less information about the background brine porosity in the uppermost sediments, resulting in fewer points being used to determine the normal porosity trend. This can be seen by comparing the middle and right panel of Figure 7.
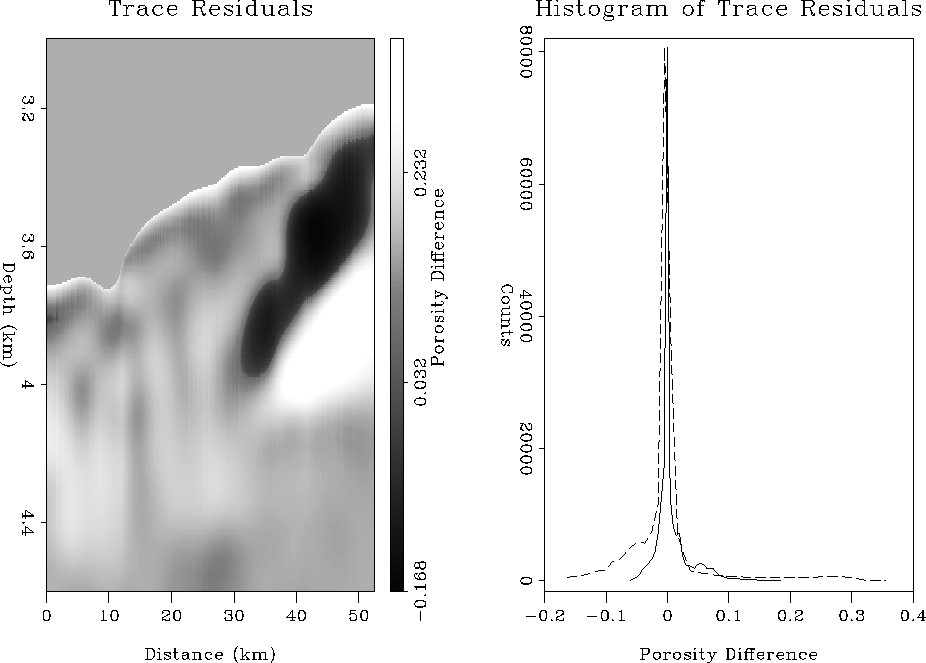
After having determined the normal brine porosity locally at every distance point, we determined the residuals again by subtracting the normal porosities from the baseline porosities. The results are displayed in Figure 8. The left side shows clearly how this method enhances both the hydrate and gas residuals with respect to the remaining brine saturated regions. The histogram makes this more obvious. The solid line represents again the residual uncertainties imposed by the misfits between the curves in the brine saturated zone between 0 and 25 km. The dashed line is the residual from the hydrate and gas saturated zones. We choose to represent hydrate by residuals below -0.06 and gas by residuals above 0.08.
 |