


Figure 11 shows a zero-offset section that contains
a large number of faults. Because of the large offsets present in this
data set, we will use the non-hyperbolic
method to invert for ![]() . VTI media induce
non-hyperbolic
moveout of reflections that depends on
. VTI media induce
non-hyperbolic
moveout of reflections that depends on ![]() and
and ![]() at
large
offsets. This non-hyperbolic moveout is used to invert
for these two parameters, which provide important information about
the subsurface. The direct
output from such an
inversion (or velocity analysis) is effective values of
at
large
offsets. This non-hyperbolic moveout is used to invert
for these two parameters, which provide important information about
the subsurface. The direct
output from such an
inversion (or velocity analysis) is effective values of ![]() and
and ![]() ,
that include the combined (average) influence of the overburden. These
effective values are converted
to interval ones using layer-stripping equations given by Alkhalifah
(1997b).
,
that include the combined (average) influence of the overburden. These
effective values are converted
to interval ones using layer-stripping equations given by Alkhalifah
(1997b).
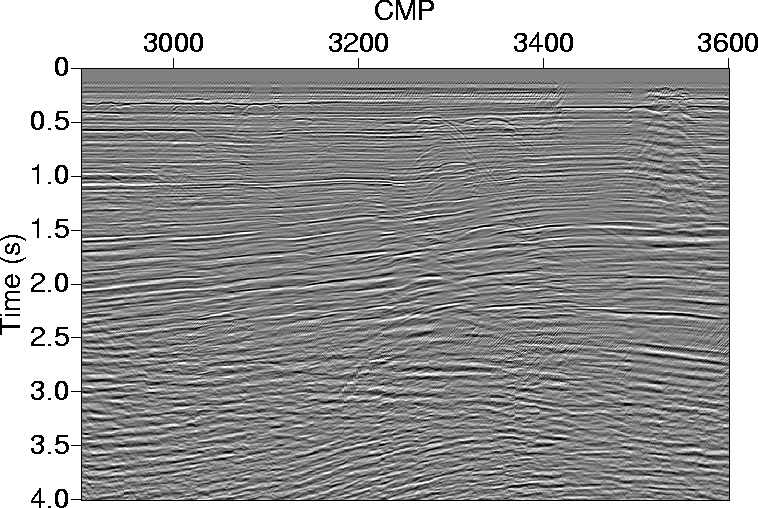 |

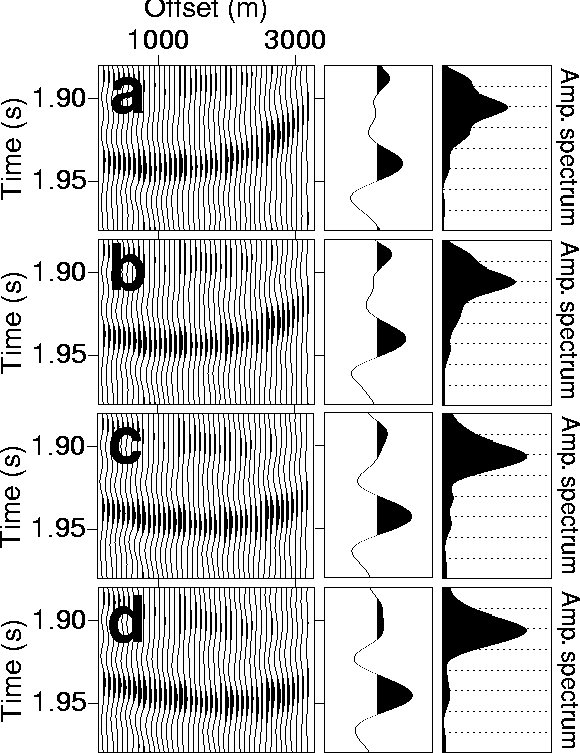
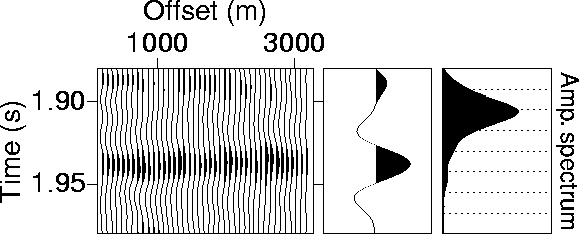
Figure 12 shows a detail of CMP gather 3100 with a reflection from a horizontal event and the reflection are NMO corrected using different stacking velocities. The highest amplitude stack trace (stack power) is obtained using a velocity of 2100 m/s. Using this velocity, however, did not result in the best resolution of the stacked trace as indicated by the amplitude spectrum. Better resolution (higher-frequency content) is achieved at a lower velocity. However, the best solution is obtained through anisotropic processing as shown in Figure 13, where the non-hyperbolic moveout in the data is treated. A shift in the zero offset time of more than 10 ms from its true value (as given by the near-offset trace) occurs after stacking the 2100 m/s NMO-corrected data.
 |
Clearly, a hyperbolic moveout approximation does not adequately approximate the non-hyperbolic moveout represented in the data. This non-hyperbolic moveout can not be explained solely by vertical velocity variations. Furthermore, the lateral inhomogeneity that is apparent in these data by observing velocities from various CMP locations is not sufficient to explain such a large non-hyperbolic moveout.
 |
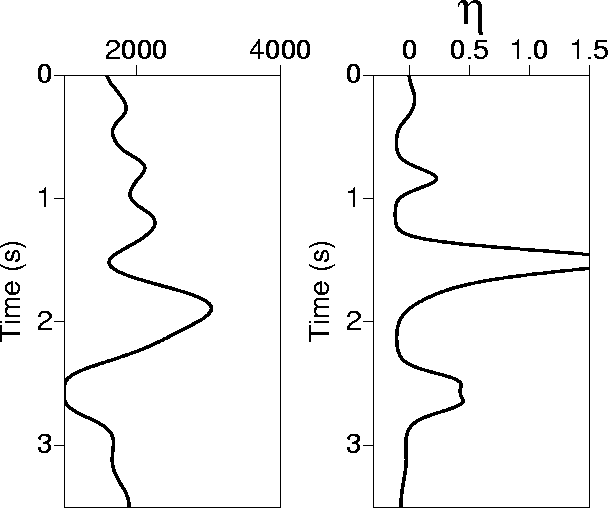 |
Figure 14 shows the interval velocity and ![]() values
extracted
from the non-hyperbolic moveout inversion
for CMP location 3200. Considering that the lateral inhomogeneity is
small, we will use these
values to do VTI DMO and time migration on the whole section (time
processing). The extremely high
values
extracted
from the non-hyperbolic moveout inversion
for CMP location 3200. Considering that the lateral inhomogeneity is
small, we will use these
values to do VTI DMO and time migration on the whole section (time
processing). The extremely high ![]() value
at time 1.5 s is indicative of a highly anisotropic shale layer. Also,
due to the integral relation between the interval values and the
effective ones, the area under
these
value
at time 1.5 s is indicative of a highly anisotropic shale layer. Also,
due to the integral relation between the interval values and the
effective ones, the area under
these ![]() curves, representing the cumulative anisotropy,
tells a better story of the anisotropic impact on the seismic data
than the values for the individual intervals. The presence of a
thick, highly anisotropic shale at relatively shallow depths (i.e., above
zones of interest) will have a serious impact on the effective
anisotropy for all deeper layers. If this shallow anisotropy is not taken into
account in this case, then degradation of the entire stacked
section will result.
Figure 15 shows the result of anisotropic DMO and when
comparing
it with Figure 11 the improvements in focusing the
horizontal, as well
as the dipping reflections, are
obvious.
curves, representing the cumulative anisotropy,
tells a better story of the anisotropic impact on the seismic data
than the values for the individual intervals. The presence of a
thick, highly anisotropic shale at relatively shallow depths (i.e., above
zones of interest) will have a serious impact on the effective
anisotropy for all deeper layers. If this shallow anisotropy is not taken into
account in this case, then degradation of the entire stacked
section will result.
Figure 15 shows the result of anisotropic DMO and when
comparing
it with Figure 11 the improvements in focusing the
horizontal, as well
as the dipping reflections, are
obvious.
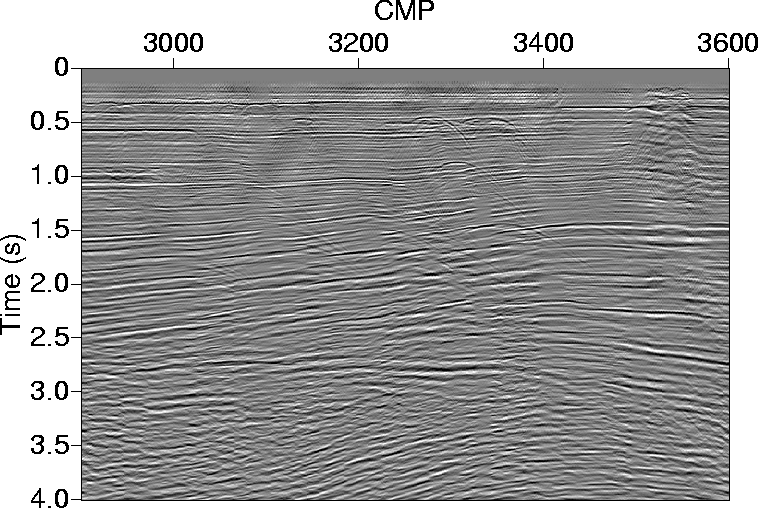 |
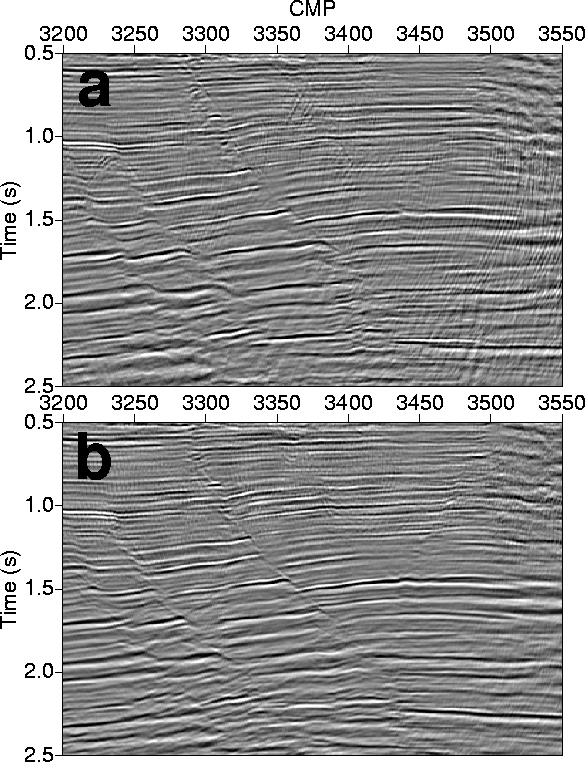
Figure 16a shows the result of isotropic migration on the isotropically DMO corrected data, while Figure 16b shows the results of a complete VTI processing, including migration. A closer look given by Figure 17 shows the improvement in fault imaging achieved with the VTI processing.
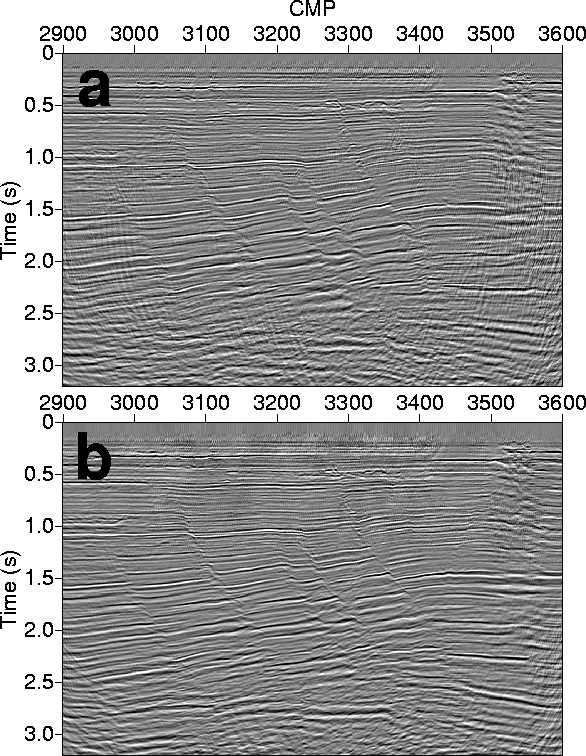 |
 |
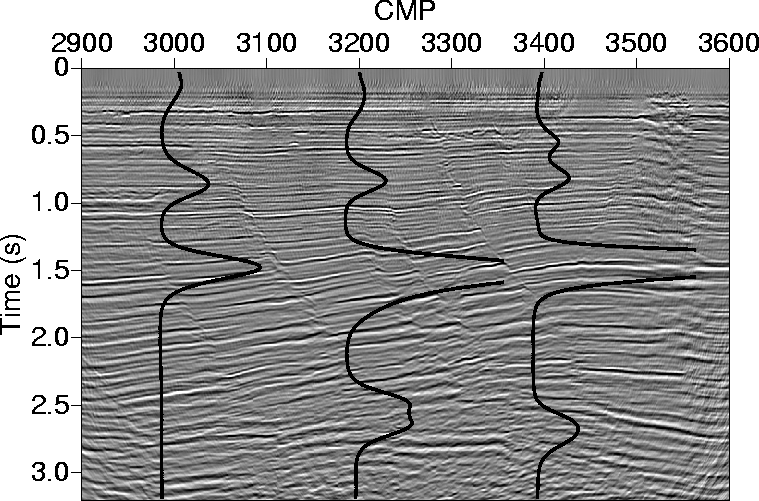 |
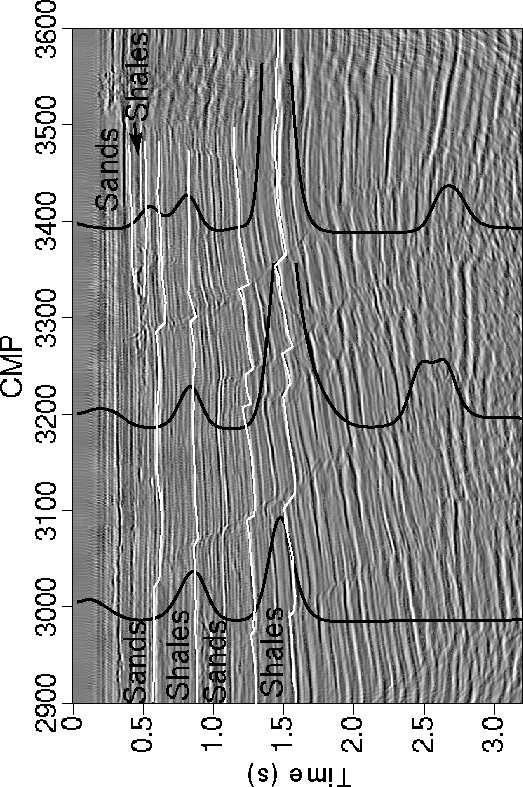
Figure 18 shows three ![]() curves superimposed on
the migrated section from Figure 16b. These
curves superimposed on
the migrated section from Figure 16b. These ![]() curves
correspond to CMP locations 3000, 3200, and 3400, and as a result they
are placed in their respective
positions in the Figure 18. Recognizing that the
curves
correspond to CMP locations 3000, 3200, and 3400, and as a result they
are placed in their respective
positions in the Figure 18. Recognizing that the ![]() highs and lows correspond
to reflections from the bottom of the layer
that caused these highs or lows, a crude blocky interpretation of the
curves
can be made and is given in Figure 19. The lateral
correlation between these
curves that are 2.5 km of
lateral distance apart is remarkable. Especially remarkable is the
correlation between the thickness of the shale layers and the size of
highs and lows correspond
to reflections from the bottom of the layer
that caused these highs or lows, a crude blocky interpretation of the
curves
can be made and is given in Figure 19. The lateral
correlation between these
curves that are 2.5 km of
lateral distance apart is remarkable. Especially remarkable is the
correlation between the thickness of the shale layers and the size of ![]() (look at
the first laterally continuous shale layer). The extremely high
(look at
the first laterally continuous shale layer). The extremely high ![]() value
at time 1.5 s is indicative of a highly anisotropic shale layer. While
the actual value may appear unreasonable, CMPs 3200 and 3400 are over
a gas field, while CMP 3000 is outside of the field
(Figure 20). The high
value
at time 1.5 s is indicative of a highly anisotropic shale layer. While
the actual value may appear unreasonable, CMPs 3200 and 3400 are over
a gas field, while CMP 3000 is outside of the field
(Figure 20). The high ![]() values over the field could
suggest vertical migration of the gas into the unconsolidated shale
(this shale is approximately 2000 feet thick at depths of 3000-5000
feet, see Figure 15).
values over the field could
suggest vertical migration of the gas into the unconsolidated shale
(this shale is approximately 2000 feet thick at depths of 3000-5000
feet, see Figure 15).
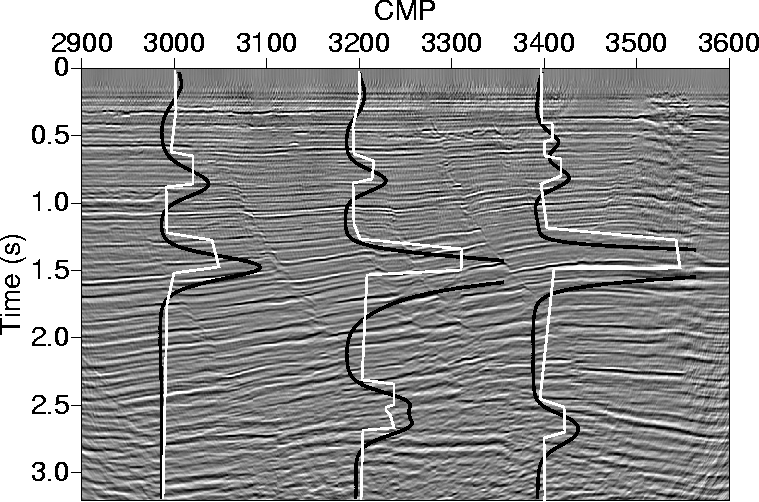 |
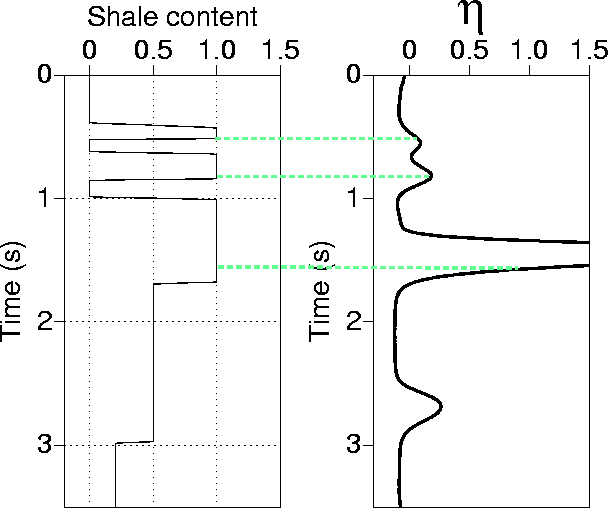
Figure 20 shows a crude lithologic interpretation
estimated solely from the anisotropic inversion. The interpretation is
based on the fact that shales are anisotropic, and therefore exhibit large
positive ![]() values,
while sands are essentially isotropic with near zero
values of
values,
while sands are essentially isotropic with near zero
values of ![]() . Figure 14 shows the correlation
between the estimate for
. Figure 14 shows the correlation
between the estimate for ![]() at CMP 3200 and a blocky
interpretation of shale volume from the gamma-ray log at a nearby
well. Correlation is remarkably good down to 2.0 seconds,
demonstrating the value of using the inversion for
at CMP 3200 and a blocky
interpretation of shale volume from the gamma-ray log at a nearby
well. Correlation is remarkably good down to 2.0 seconds,
demonstrating the value of using the inversion for ![]() as a
lithology estimator. Correlation is not as good below 2.0 seconds,
though the
as a
lithology estimator. Correlation is not as good below 2.0 seconds,
though the ![]() value shown in Figure 21 shows
a large decrease in velocity below 2.0 seconds indicative of entering
the overpressure zone (which could also impact anisotropy).
value shown in Figure 21 shows
a large decrease in velocity below 2.0 seconds indicative of entering
the overpressure zone (which could also impact anisotropy).
 |
 |