|
zprtz.1500
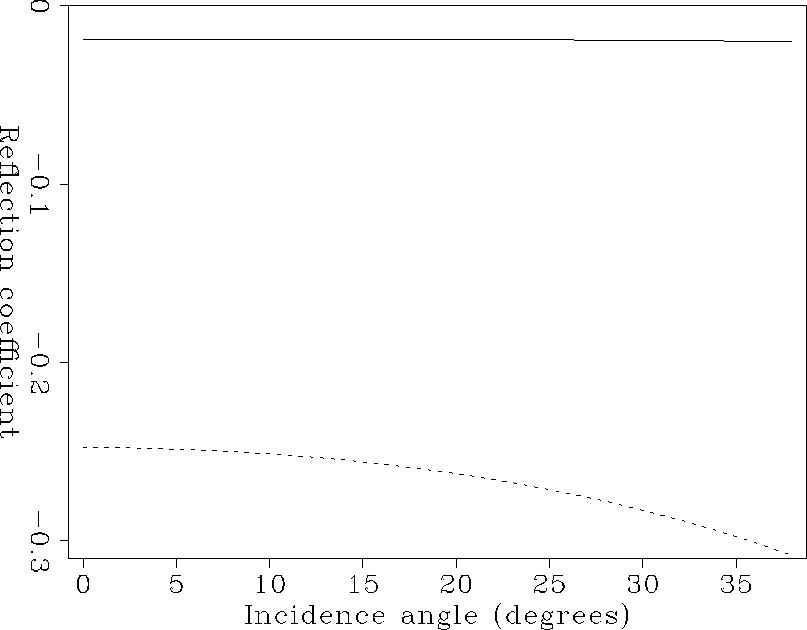
Figure 5 Reflection coefficient verses reflection angle at 1.5 kilometers. Gas saturated is plotted with a dashed line and brine saturated is plotted with a solid line. |  |
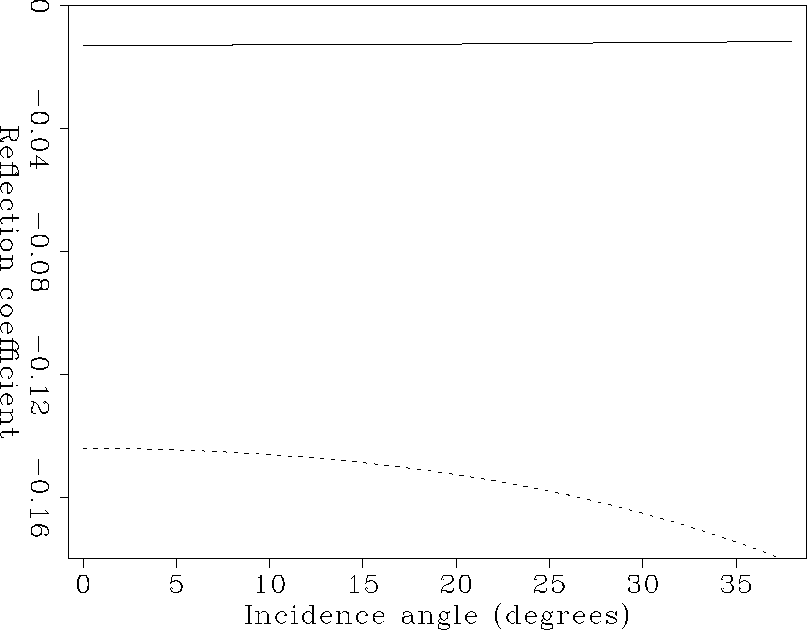
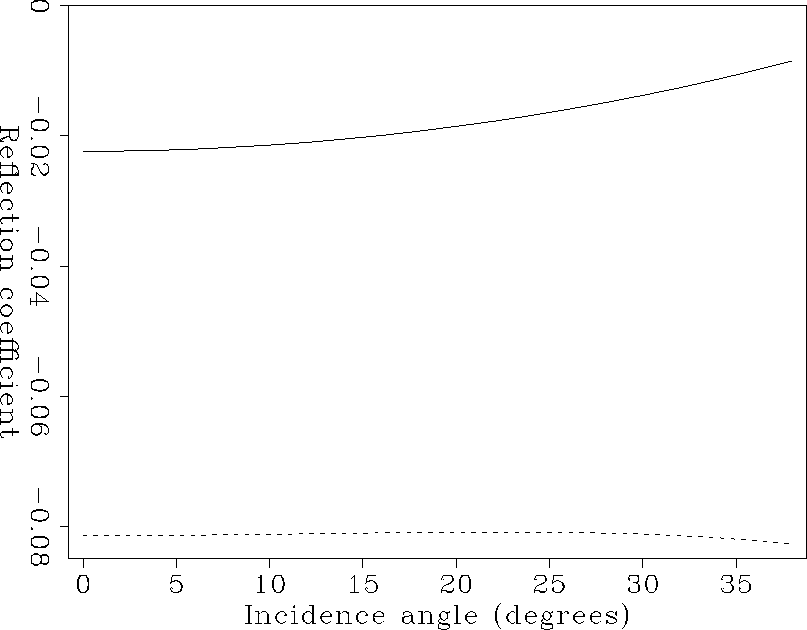
Figure 5 shows reflection coefficient as a function of angle for a shale/sand interface at 1.5 km depth. Figures 6 and 7 show the same for interfaces at 2.4 km and 4 km depth.
|
zprtz.1500
Figure 5 Reflection coefficient verses reflection angle at 1.5 kilometers. Gas saturated is plotted with a dashed line and brine saturated is plotted with a solid line. |  |
|
zprtz.2400
Figure 6 Reflection coefficient verses reflection angle at 2.4 kilometers. Gas saturated is plotted with a dashed line and brine saturated is plotted with a solid line. |  |
|
zprtz.4000
Figure 7 Reflection coefficient verses reflection angle at 4 kilometers. Gas saturated is plotted with a dashed line and brine saturated is plotted with a solid line. |  |