 |
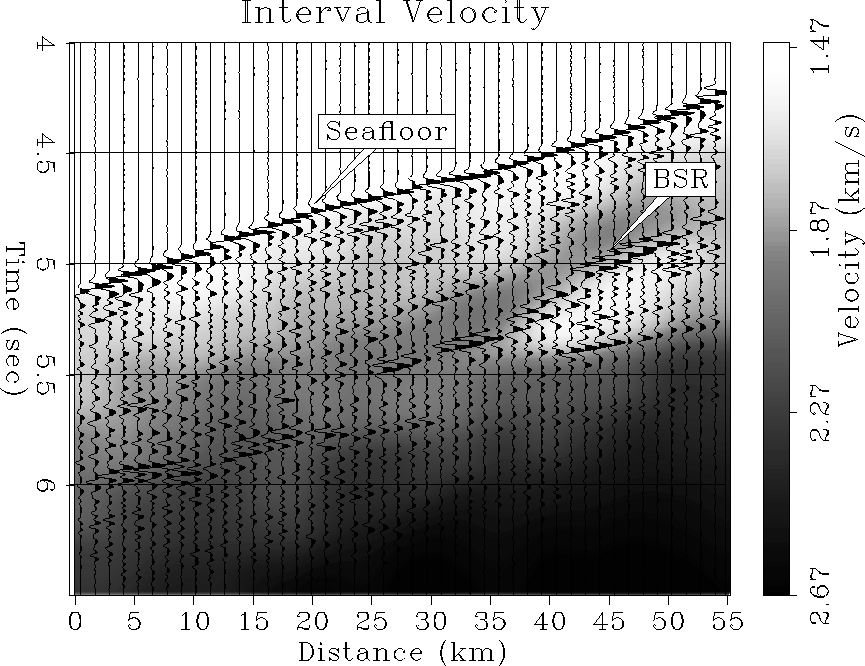
Figure 3 Interval velocity of the data.
Interval velocities along the section were obtained from the RMS stacking velocities using Dix's equation. The resulting 2-D velocity field, overlain by the stacked section, can be seen in Figure 3. It shows an increase in the velocity above the BSR to about 1.9 km/s and a decrease to approximately 1.55-1.6 km/s underneath. The presence of hydrate in sediments is often associated with an increase of velocity. The low-velocity zone beneath it is indicative of the sediments being gas saturated. The accumulation of free gas beneath the BSR can be explained by the hydrate acting as impermeable seal Ecker et al. (1996) and thus trapping the gas underneath. The velocity contrast becomes less and less pronounced closer to the termination point of the BSR at approximately 25 km. Both the absence of free gas underneath the hydrate and the possible reduction of the amount of hydrate present can be related to this decrease in velocity contrast.
 |
In order to get an idea of the magnitude of the amplitude variation in the area, and in order to be able to scale the amplitudes in the later AVO analysis, I used the first multiple of the seafloor to calculate the reflectance of the reflections. In a layered medium, this reflectance is similar to the true reflection coefficient Warner (1990):
![]() and
and ![]()
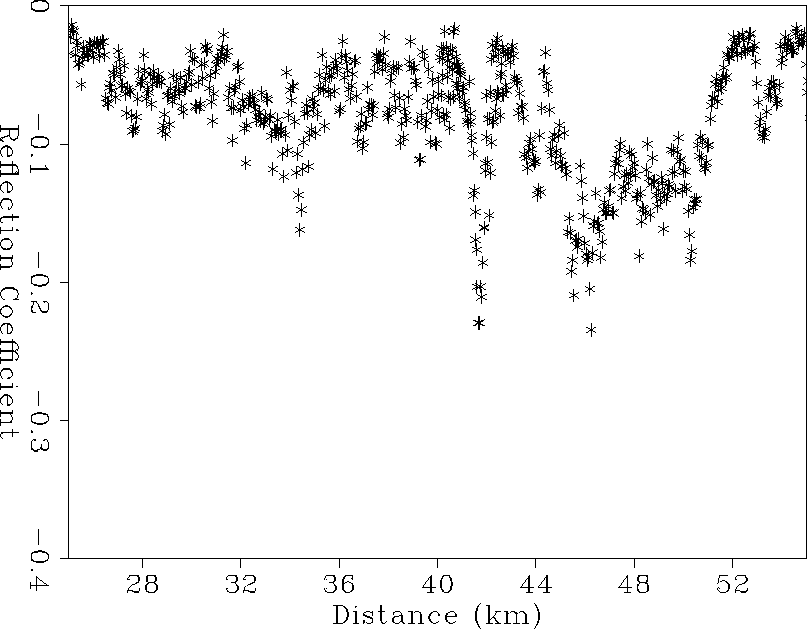
where Rw is the reflection coefficient of the seafloor, Aw is the amplitude of the seafloor reflection and Am that of its first multiple. The reflection coefficient of the ith layer is given by Ri and Ai is the amplitude of the ith reflection. The resulting 2-D reflection amplitude map can be seen in Figure 4. It is obvious that the strong BSR reflection coincides with the free gas trapped beneath the BSR. Picking the maximum BSR amplitudes (Figure 5) shows that the amplitude is nearly twice as strong between 45 and 50 km than elsewhere. The decrease of amplitudes in the region of BSR discontinuity (between 35 and 45 km) might be related some change of the local hydrate properties in the area. At the flank of the BSR the decrease is caused by the decreasing velocity contrast. The absence of free gas in itself will already cause the impedance contrast to be significantly weaker in this area. Furthermore, the amount of hydrate in the sediment might be decreasing, thus not inducing enough velocity increase in the hydrate. There might be less hydrate in the sediment pore space, causing a less pronounced velocity contrast. The ODP drilling in the area recovered hydrate even from regions without apparent BSR in surface seismic Matsumoto et al. (1996). This appears to support the fact that the amount of hydrate occupying the pore space might be decreasing.
 |
|
bsr-picks
Figure 5 Amplitude picks along the BSR. |  |