 |
Figure 7 The relation between F-X noise suppression and our scheme. We estimate the spatial prediction filter in the pyramid domain. The dashed-line box includes all the operations in the pyramid domain.
In this section, we compare our new sampling scheme in the application of signal/noise separation with F-X noise suppression. We expect that our scheme will produce better results. Figure 7 shows the relation and difference between the two implementations:
 |
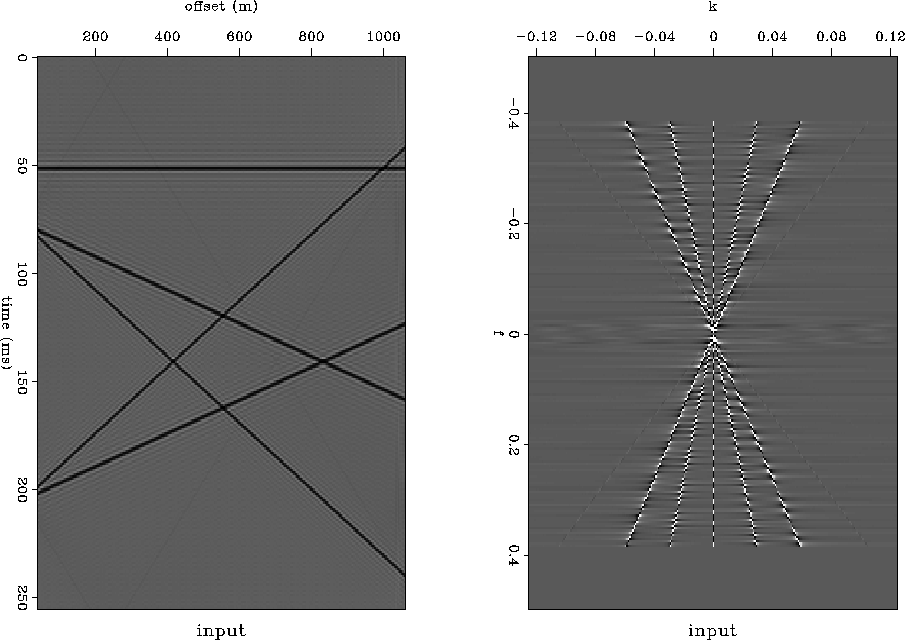
The input dataset is composed of one horizontal event, four dipping events. This dataset has no random noise. Therefore, it is fully predictable. We use this data to test whether subsampling will influence the predictability of each frequency slice. Figure 8 shows the data in both t-x and f-x domain.
 |
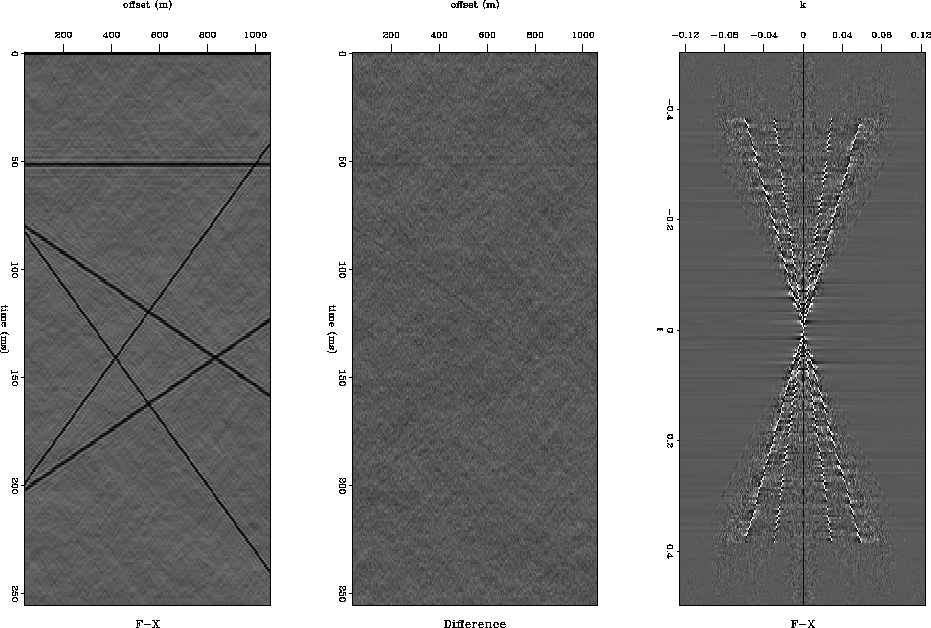
F-X noise suppression algorithm estimates the spatial prediction filter for each frequency slice and then applies it to the input data. Figure 9 shows that there is little difference between input and output. This means that if there is no noise or aliased energy in the dataset, the prediction filter will produce a dataset which is the same as the input.
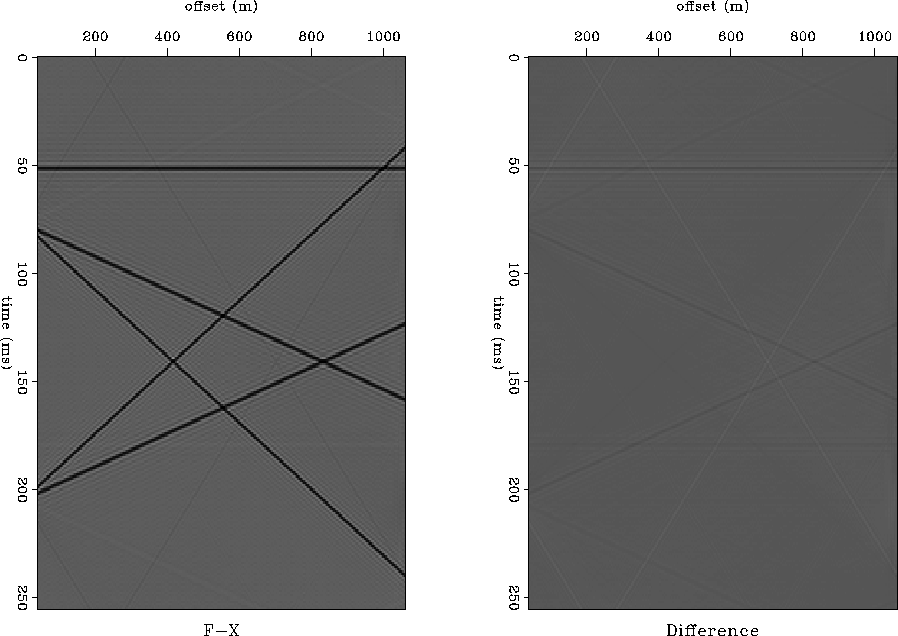 |
Figure 10 is the corresponding result from our scheme. It is clear that subsampling does not make the frequency slice more unpredictable. All the five events have been retained after convolving the prediction filter with the input dataset.
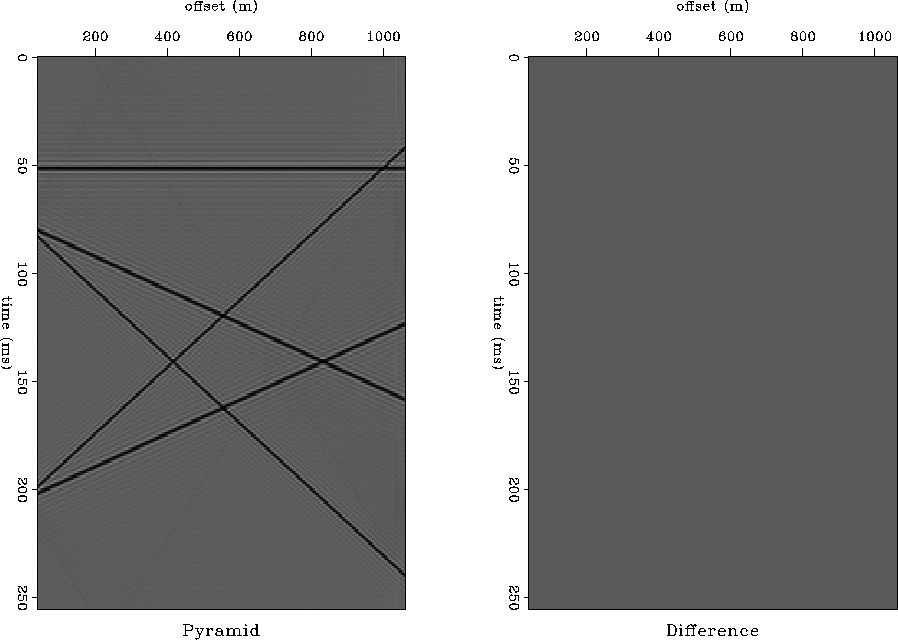 |
Figure 11 is the relative residual error for each frequency. It is interesting to notice that subsampled dataset is even more predictable than the oversampled dataset.
|
error1
Figure 11 Squared error for both F-X noise suppression and Pyramid scheme. Notice that the subsampled dataset is even more predictable than the oversampled dataset. | 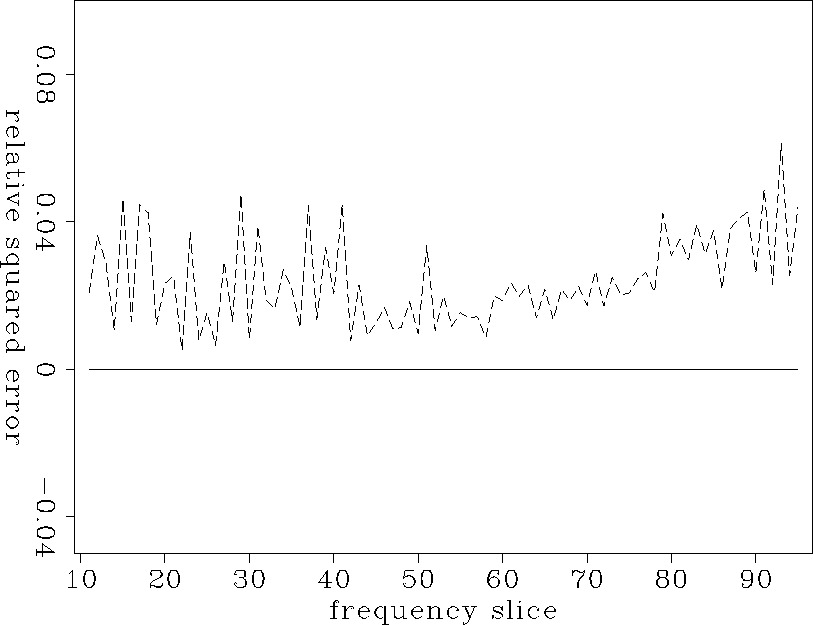 |
The second dataset is the same as the first one, except that we introduce random noise into it, as shown in Figure 12.
 |
Unfortunately, we have not got very good results from noisy data. As shown in Figure 13, F-X noise suppression cannot remove low frequency noise. Therefore, the difference is very small. Although Pyramid scheme can remove some parts of low frequency noise, it can also hurt the signal at the same time. We will keep working on it and try to get a better result.
 |
 |
|
error2
Figure 15 Squared error for both schemes. |  |