

Next: CONCLUSIONS
Up: APPLICATION OF WAVELET-BASED COMPRESSION
Previous: Synthetic 3-D data
The field data is a 3-D marine seismic sail line from the North Sea.
The survey system consists of two sources and three streamers.
There are many conflicting dipping reflections and high frequency diffraction
hyperbolas in the dataset, which provide a critical challenge to this
compression technique. In this application, we compress the dataset in two
ways: before NMO correction (case A) and after NMO correction (case B).
The size of this dataset is n1=500, n2=112, n3=6, and
n4=150. We compress/decompress the two different kinds of dataset at three
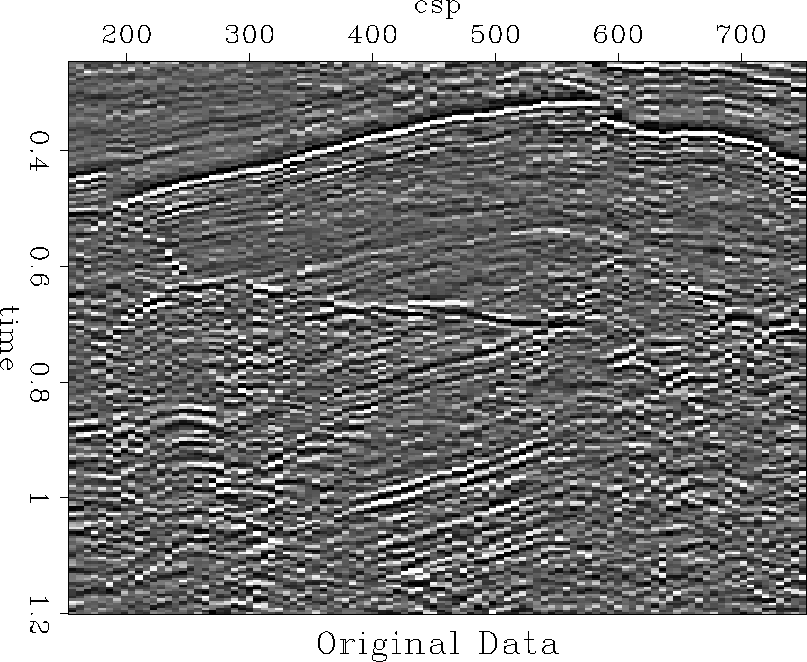
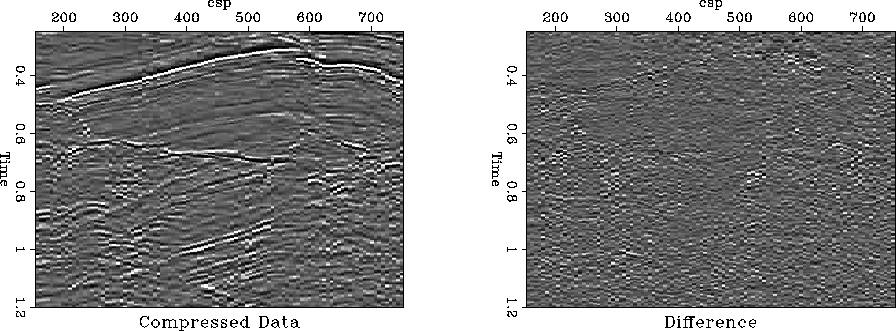
compression ratio levels, 40, 70, and 100. Figure 14 is
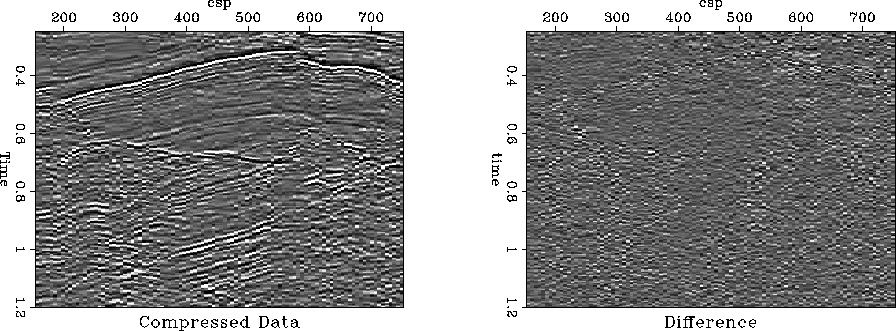
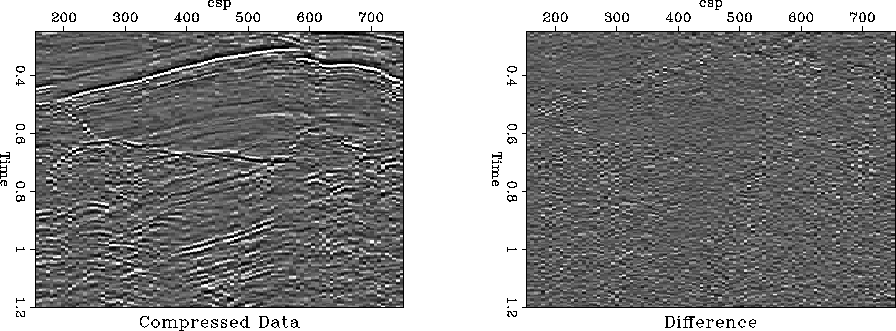
the original dataset. Figures 15 and 16 are
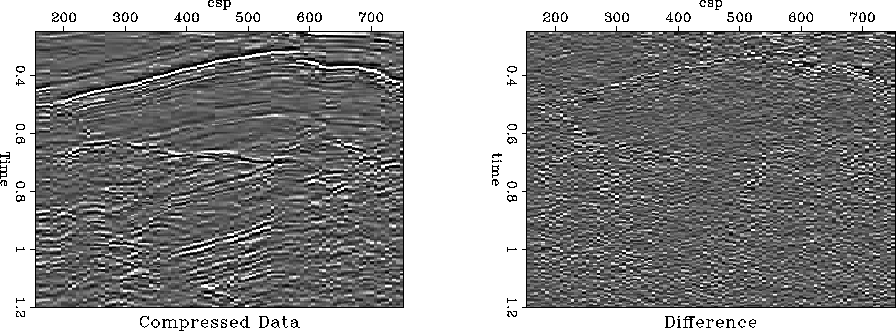
the results of CompRatio=40. Figures 17 and
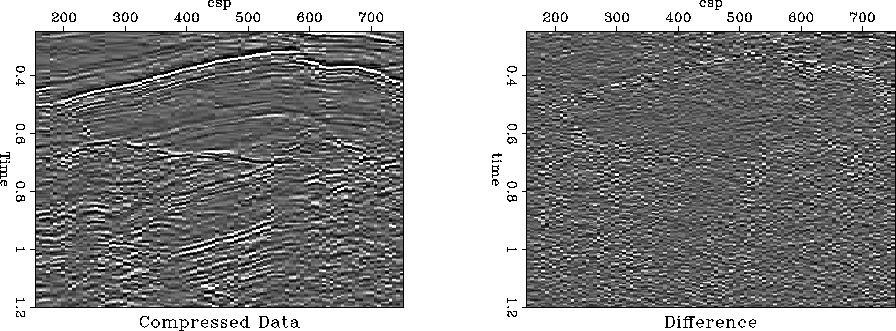
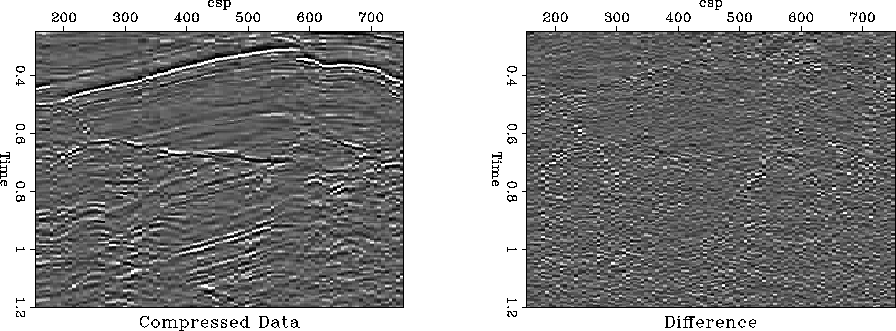
18 are the results of CompRatio=70. Figures 19
and 20 are the results of CompRatio=100.
syl12DW
Figure 14 Original 2-D near-offset section of the North Sea dataset (extracting the near-offset trace from each CSP gather).


 syl12D31W
Figure 15 Result from case A (CompRatio=40, SNR=3.95dB).


 syl1nmo2D25W
Figure 16 Result from case B (CompRatio=40, SNR=4.01dB).


 syl12D51W
Figure 17 Result from case A (CompRatio=70, SNR=2.94dB).


 syl1nmo2D41W
Figure 18 Result from case B (CompRatio=70, SNR=3.09dB).


 syl12D65W
Figure 19 Result from case A (CompRatio=100, SNR=2.65).


 syl1nmo2D54W
Figure 20 Result from case B (CompRatio=100, SNR=2.78dB).


As shown in the figures, the result of after NMO correction is better than that
of before NMO correction for each of the three compression levels. This is
because NMO correction can strengthen the extent of coherency in the dataset.
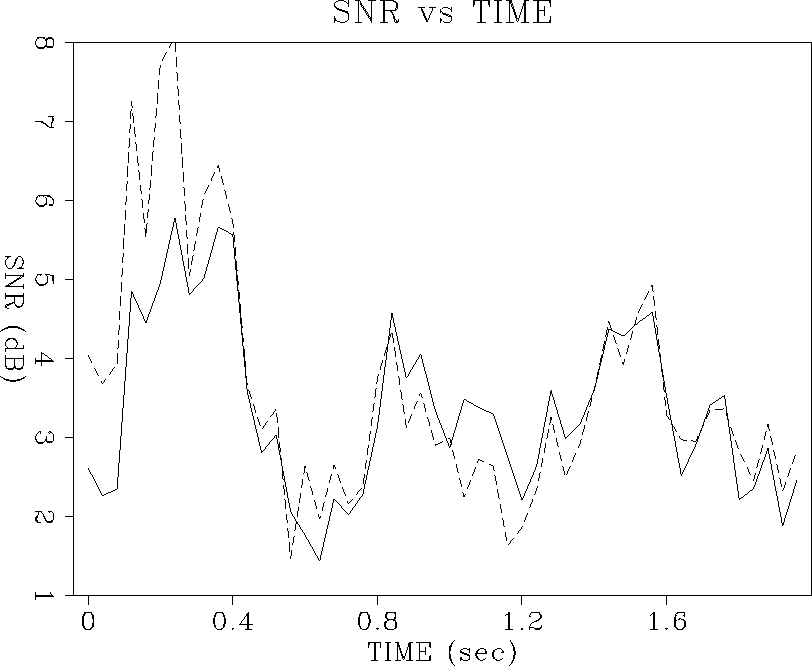
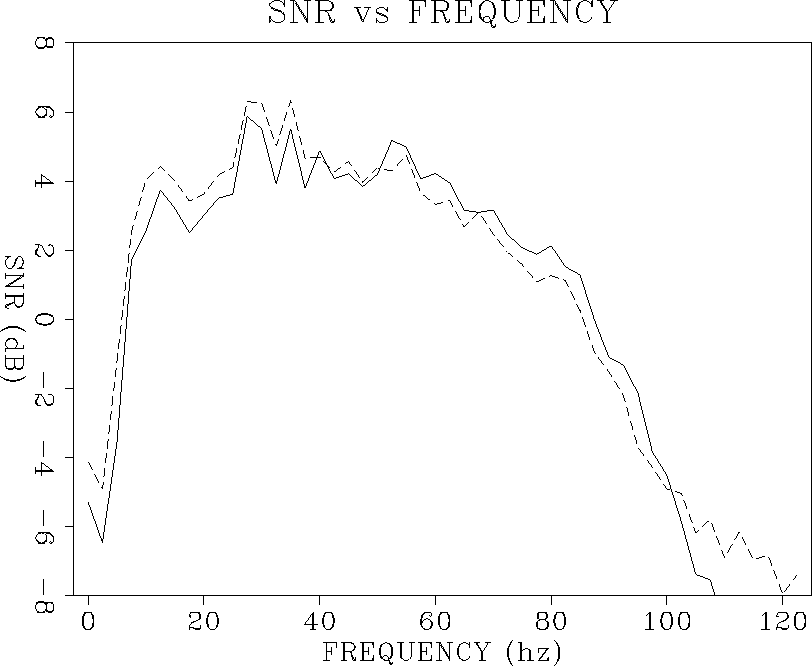
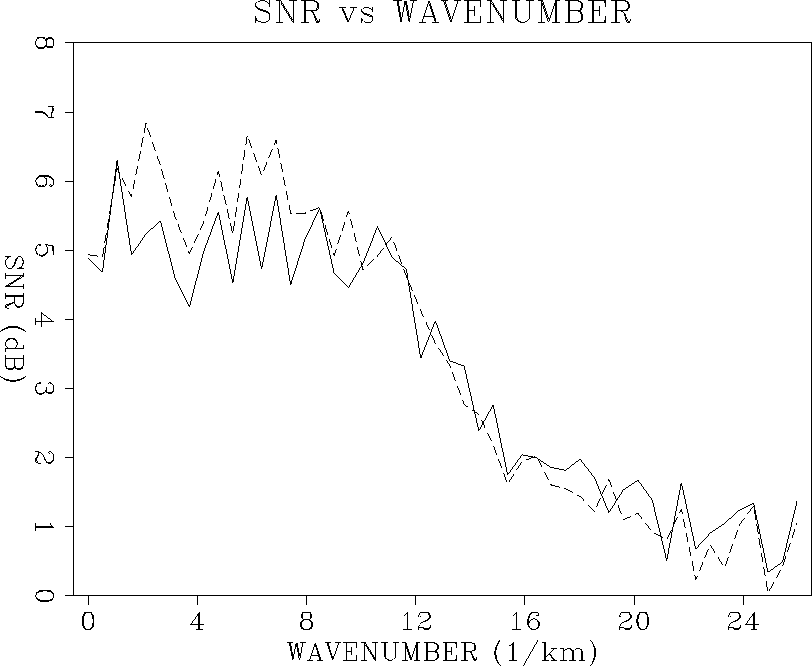
The SNR of the whole dataset is higher in case B. We choose the result of
CompRatio=70 to analyze the change of SNR in the time domain, frequency
domain, and wavenumber domain, as shown in Figures 21,
22, and 23.
In the time domain, the shallow zone result of post-NMO correction is
prominently better than case A. In the deep zone, which is mainly composed of
high-frequency uncorrelated noise, the SNR has decreased greatly in both cases.
In the frequency and wavenumber domain, they show similar results, i.e., the
result of case B is better than that of A in the low-frequency and
low-wavenumber areas. In the high-frequency and high-wavenumber ranges, the
accuracy of this compression algorithm is lowered.
TIMESNR44
Figure 21 SNR vs TIME. The solid line represents case A and the dashed line case B.


 FREQSNR44
Figure 22 SNR vs FREQUENCY. The solid line represents case A and the dashed line case B.


 WAVENUMBERSNR44
Figure 23 SNR vs WAVENUMBER. The solid line represents case A and dashed line case B.


Next: CONCLUSIONS
Up: APPLICATION OF WAVELET-BASED COMPRESSION
Previous: Synthetic 3-D data
Stanford Exploration Project
11/12/1997
