

Next: CONCLUSION
Up: Chemingui & Biondi: Handling
Previous: Acquisition Geometry
To examine the amplitude behavior of the imaging operators in the sequence,
we designed a synthetic reflectivity model which simulates a flat
reflector with amplitude anomalies along its surface.
The model is 10,000 by 10,000 feet wide, which is about the size of
the real survey area. The anomaly
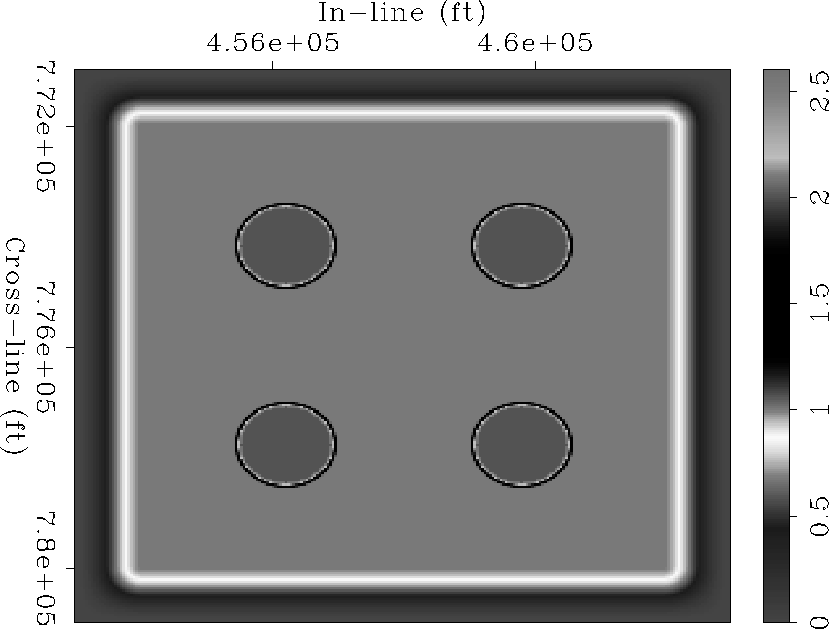
zones take the form of circles of high reflectivity.
Figure 6 shows a cross section of
the synthetic model taken at the top
of the flat reflector. The edges of the model are tapered to avoid
numerical diffractions from the modeling algorithm.
For the sake of simplicity, we consider a medium with a constant
velocity of 10,000 ft/sec.
In a first experiment, we modeled the reflector using regular constant offset
geometry. The survey simulates a zero-azimuth acquisition, and an
offset of 8000 ft with regular mid-point spacing of
62.5 ft. Figure 7 shows
the migration of the regular CA/CO cube. As expected, the migration
produced a nice image and successfully inverted for the reflectivity
function along the reflector. The edges of the circular
anomalies have been slightly smeared along
the zero-azimuth acquisition direction
(in-line direction).
In a second experiment, we modeled the reflector using the Button-Patch
geometry of the real 3-D survey. We extracted a total of 24,000 traces
whose source-receiver azimuth is between -30o and 30o
with an absolute offset range from 7000 to 9000 ft. The results of
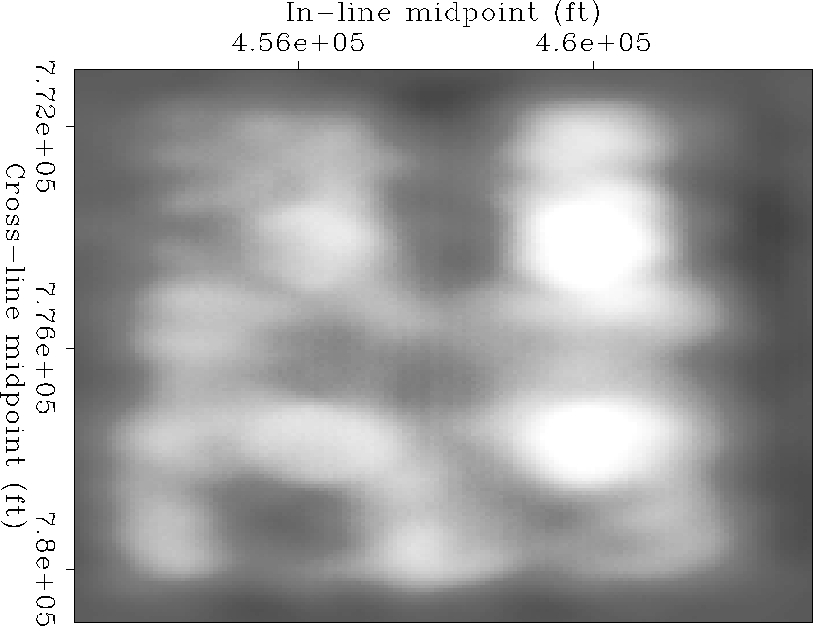
the migrated image are shown in figure 7. The reflectivity
map has a very poor resolution and suffers amplitude distortions scattered
along all the flat reflector. A direct correlation is noted between the
areas of low coverage and the resolution of the reflectivity map. The
two anomalies on the left of section suffered the most distortion since
many of the missing traces correspond to that side of the map.
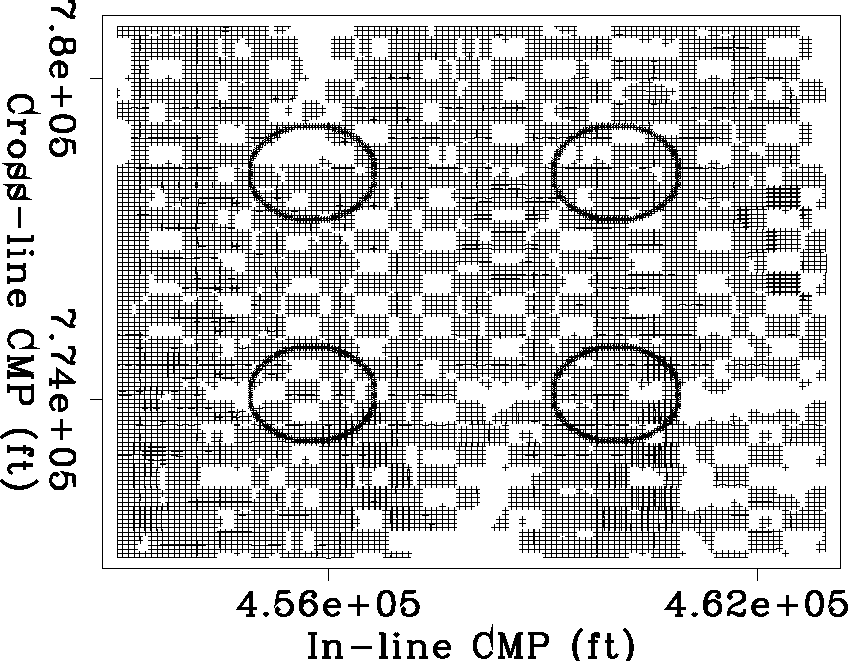
Figure 9 shows the location of the anomalies overlaying
the mid-point geometry of the input traces. The two left anomalies
are poorly sampled, much beyond aliasing.
We conclude that
Kirchhoff migration on its own was unable to preserve the amplitude of the
reflector and resolve for the anomalous locations in the presence of very sparse
and irregular coverage.
In a final experiment, we applied the AMO transformation to regularize the
geometry and reconstruct the data as a zero-azimuth cube
with an 8000 ft effective absolute offset and constant mid-point spacing
of 62.5 ft. The CA/CO cube is then imaged using
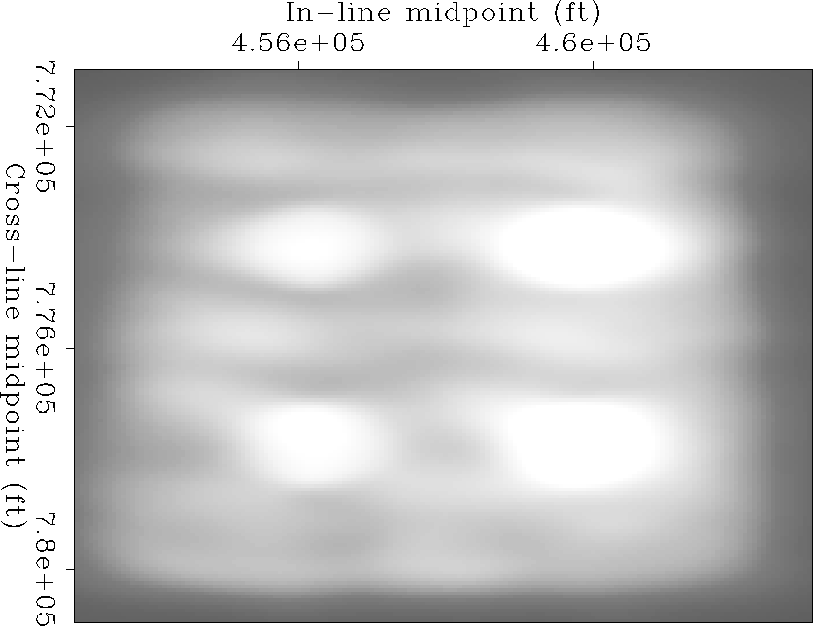
the 3-D prestack depth migration algorithm. Figure 10 shows
the results of the migration after applying AMO. The migrated
image shows better resolution than the previous experiment. The
AMO transformation before migration eliminated
most of the amplitude
distortions along the horizontal reflector and nicely imaged the
location of the anomalies. The lower left zone is better defined, whereas
the upper left anomaly is still not fully recovered. That anomaly
corresponds to an extreme case of poor trace coverage. The
AMO operator in its Kirchhoff implementation could not perfectly reconstruct
the reflectivity at that location.
We conclude that interpolating the data and regularizing its geometry
before migration can help a great deal in preserving its amplitude. AMO
lends itself as a convenient tool for organizing the data for common-azimuth
processing while correcting for its sparse and irregular coverage.
model
Figure 6 Synthetic reflectivity model of a flat reflector. The white circles are zones of high reflection coefficient of 2.5 in a constant background of unit reflectivity.


 mig-reg
Figure 7 Image of the reflectivity map obtained by migrating a regular cube from a zero-azimuth constant-offset experiment.


 mig-irr
Figure 8 Reflectivity map obtained by direct Kirchhoff migration traces modeled using the real 3-D irregular geometry


 overlay
Figure 9 Location of the amplitude anomalies overlaying the mid-point geometry of the recording traces.


 amo
amo
Figure 10 Reflectivity map obtained by migrating the data after applying the AMO transformation to an effective zero-azimuth and a constant offset of 8000 ft.


Next: CONCLUSION
Up: Chemingui & Biondi: Handling
Previous: Acquisition Geometry
Stanford Exploration Project
11/12/1997


