

Next: INTEGRATED INTERPRETATION
Up: TRAVELTIME AND VELOCITY ANALYSIS
Previous: Velocity analysis
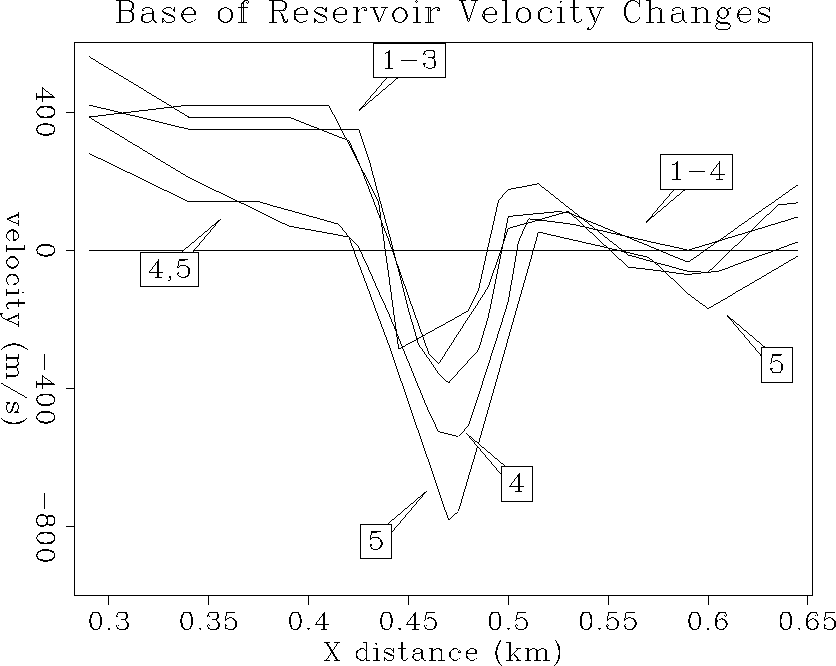
Figure 29 shows the resulting changes in velocity.
In the center of the pattern, at the steam injector, the velocity
decreases by up to 800 m/s after 19 months of steam injection.
Assuming an interval velocity of 2.0 km/s for the reservoir,
this velocity contrast works out to be -40%, which is exactly what
was predicted by the steamflood model and core data!
To the west of the injector, the velocity initially increases by about
400 m/s, which is about +20%. Again, this is exactly what was predicted
for the pressure front in the absence of heat.
At 13 and 19 months (monitors
4 and 5), the pressure front loses some of its velocity contrast, probably
due to heating from the expanding steam zone.
On the east side, a 100-200 m/s velocity increase (+5-10%) is consistent
with an annulus of hot water. Beyond that, the reservoir changes
very little until the fifth survey where a velocity decrease of 200 m/s (-10%)
seems to indicate heat has just arrived.
res0t
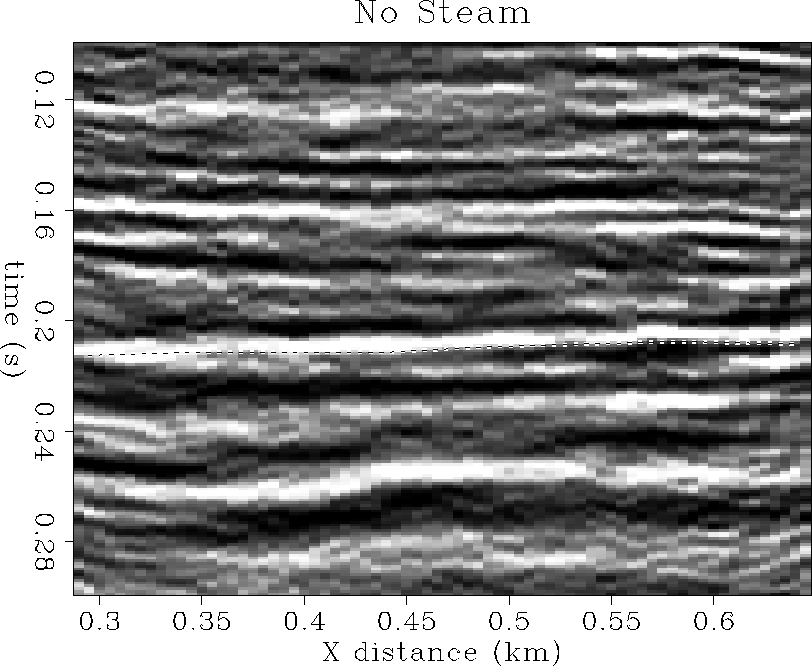
Figure 21 Traveltime picks before steam injection
 res1t
res1t
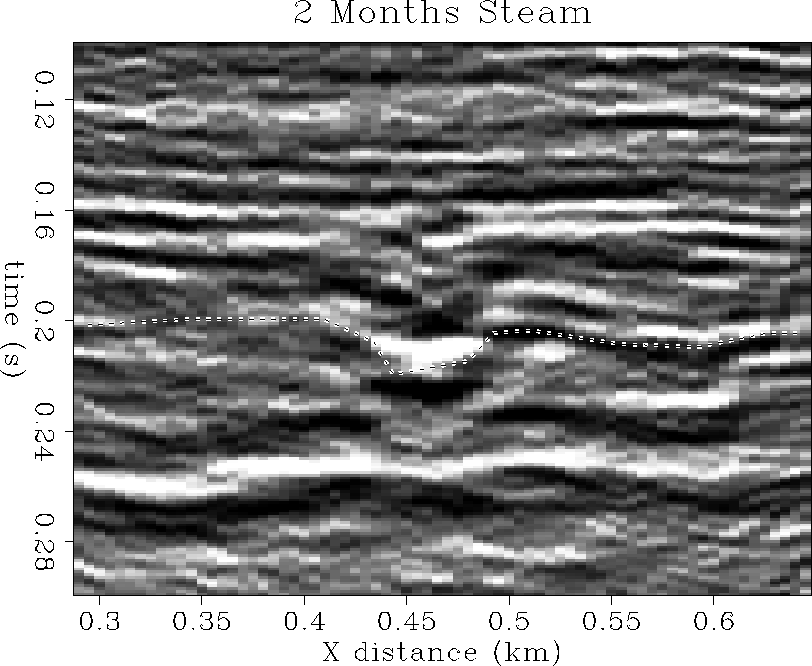
Figure 22 Traveltime picks after 2 months of steam
 res2t
res2t
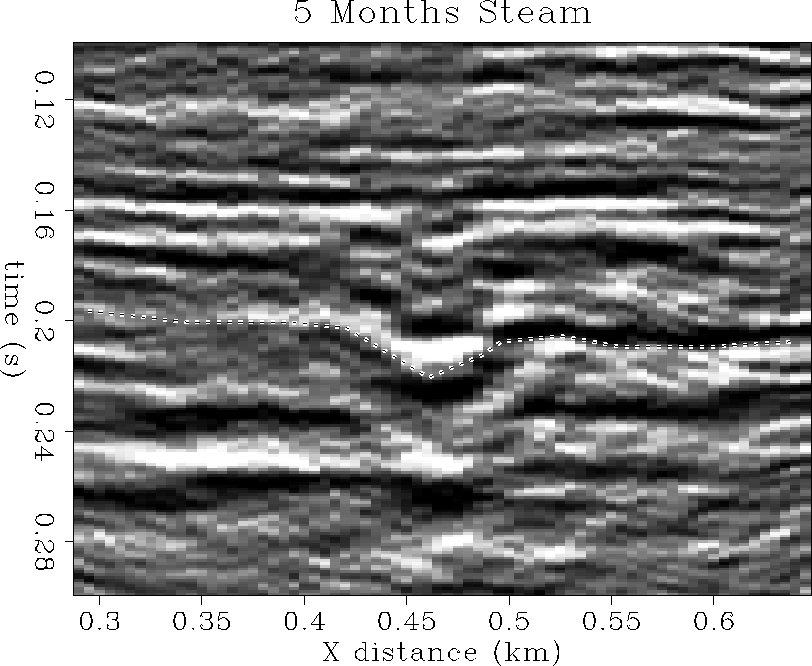
Figure 23 Traveltime picks after 5 months of steam
 res3t
res3t
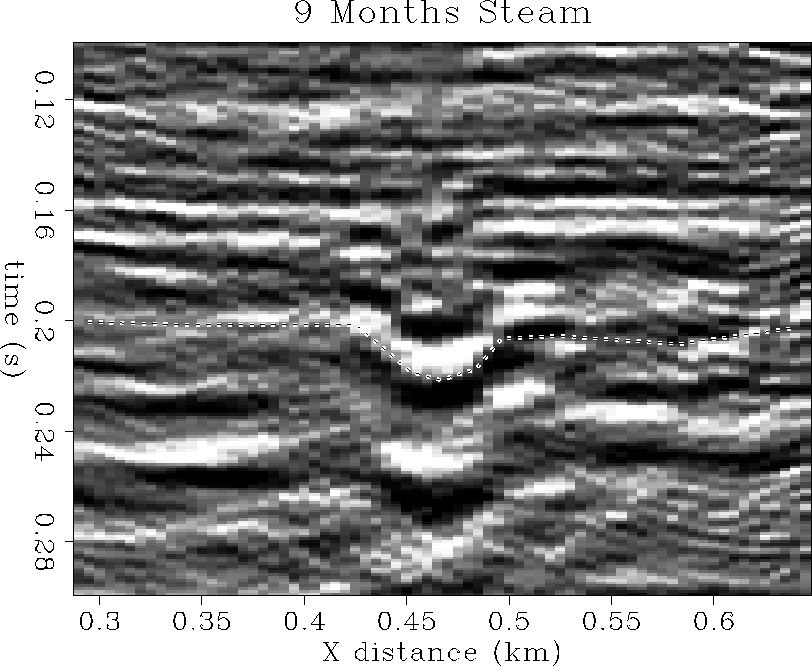
Figure 24 Traveltime picks after 9 months of steam
 res4t
res4t
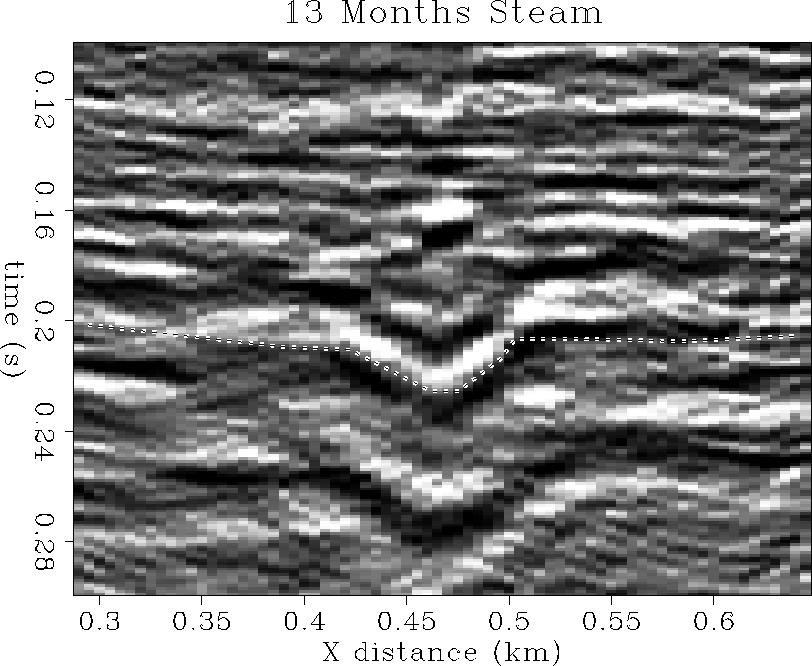
Figure 25 Traveltime picks after 13 months of steam
 res5t
res5t
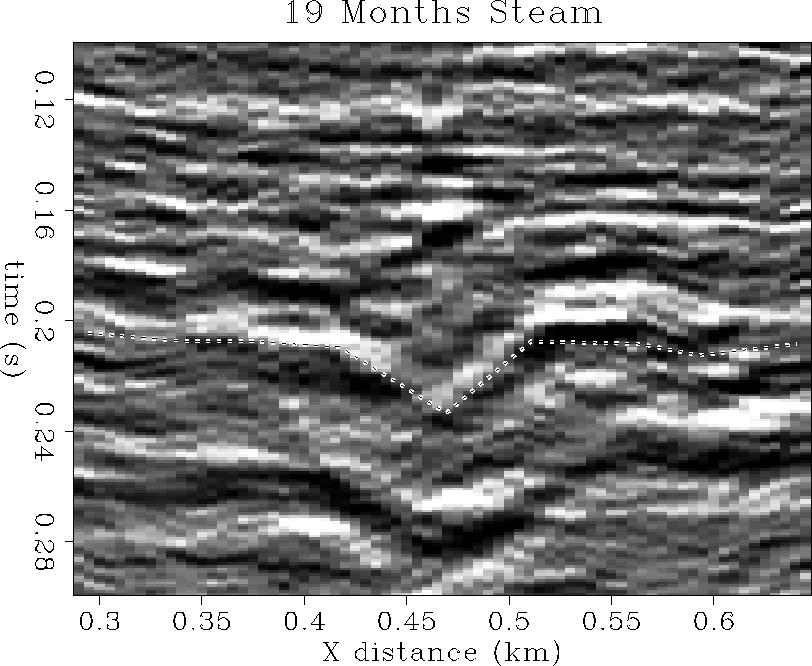
Figure 26 Traveltime picks after 19 months of steam
 tcurves-ann
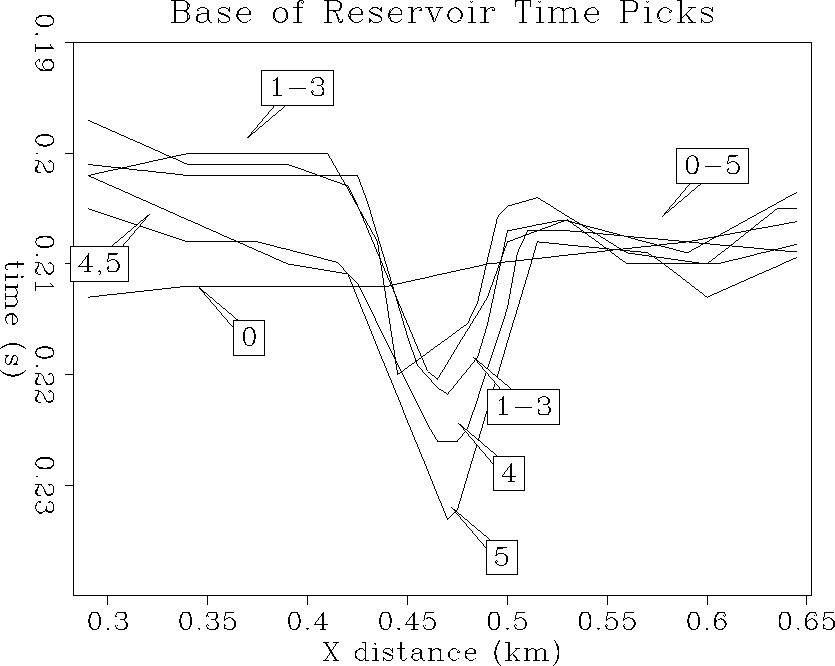
Figure 27 Traveltime picks along the base of the P formation
from all six time-lapse seismic images.
 dtcurves-ann
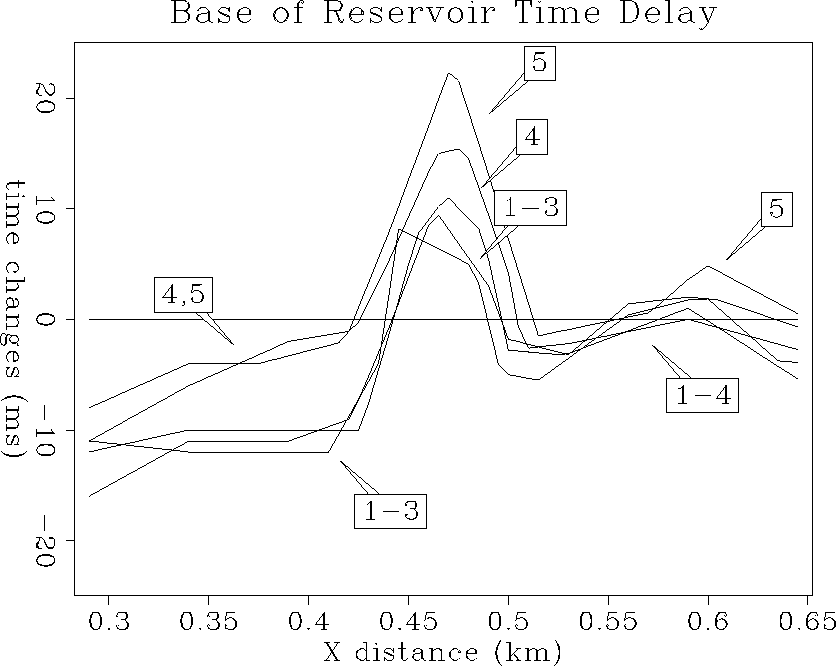
Figure 28 Traveltime changes along the base of the P formation
from all six time-lapse seismic images.
 dvcurves-ann
Figure 29 Velocity changes along the base of the P formation
from all six time-lapse seismic images.


Next: INTEGRATED INTERPRETATION
Up: TRAVELTIME AND VELOCITY ANALYSIS
Previous: Velocity analysis
Stanford Exploration Project
11/12/1997
