

Next: Layer-Stripping Kirchhoff migration
Up: First-arrival traveltimes in complex
Previous: Comparison of acoustic wavefields
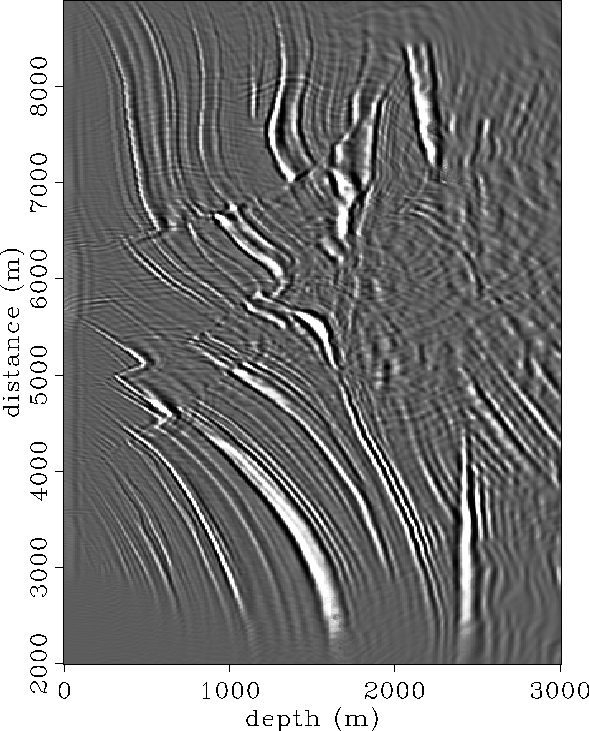
Figure ![[*]](http://sepwww.stanford.edu/latex2html/cross_ref_motif.gif) is the result of
an industry standard Kirchhoff migration
of the Marmousi synthetic using first-arrival traveltimes calculated
with a finite-difference eikonal equation solver. The faults and beds
in the upper
portion are well imaged; however, the anticlinal structure below 2300 m and
the target zone at a lateral position of about 6500 m
and depth of 2500 m is not imaged.
is the result of
an industry standard Kirchhoff migration
of the Marmousi synthetic using first-arrival traveltimes calculated
with a finite-difference eikonal equation solver. The faults and beds
in the upper
portion are well imaged; however, the anticlinal structure below 2300 m and
the target zone at a lateral position of about 6500 m
and depth of 2500 m is not imaged.
The migration result corresponds exactly to the observations made in comparing
the acoustic wavefield modeling to contours of first-arrival
traveltime. The upper 1500 m to 2000 m of the migration which is well imaged
corresponds to the wavefields and contours of Figure ![[*]](http://sepwww.stanford.edu/latex2html/cross_ref_motif.gif) .
In this part of the model, the first-arrival traveltimes accurately parameterize
the high energy portion of the wavefield. The left and right sides
of the figure are nicely imaged because the velocity model is relatively
simple in these areas.
The central portion of the image, at the target zone, corresponds to
the wavefields and traveltime contours of Figure
.
In this part of the model, the first-arrival traveltimes accurately parameterize
the high energy portion of the wavefield. The left and right sides
of the figure are nicely imaged because the velocity model is relatively
simple in these areas.
The central portion of the image, at the target zone, corresponds to
the wavefields and traveltime contours of Figure ![[*]](http://sepwww.stanford.edu/latex2html/cross_ref_motif.gif) . The
propagation here is complicated by the overlying faults which contain
fast and slow velocity regions, and by the high velocity salt
which partially overlays the target.
. The
propagation here is complicated by the overlying faults which contain
fast and slow velocity regions, and by the high velocity salt
which partially overlays the target.
The properties of first-arrival traveltimes described in the
preceding section, as well as the observation that
Kirchhoff migration using first-arrival traveltimes produces an
acceptable image of the upper part of the Marmousi synthetic,
motivated the development of the layer-stripping method described next.
standard
Figure 7 Standard Kirchhoff migration using first-arrival traveltimes.
![[*]](http://sepwww.stanford.edu/latex2html/movie.gif)


Next: Layer-Stripping Kirchhoff migration
Up: First-arrival traveltimes in complex
Previous: Comparison of acoustic wavefields
Stanford Exploration Project
2/12/2001
![[*]](http://sepwww.stanford.edu/latex2html/cross_ref_motif.gif) is the result of
an industry standard Kirchhoff migration
of the Marmousi synthetic using first-arrival traveltimes calculated
with a finite-difference eikonal equation solver. The faults and beds
in the upper
portion are well imaged; however, the anticlinal structure below 2300 m and
the target zone at a lateral position of about 6500 m
and depth of 2500 m is not imaged.
is the result of
an industry standard Kirchhoff migration
of the Marmousi synthetic using first-arrival traveltimes calculated
with a finite-difference eikonal equation solver. The faults and beds
in the upper
portion are well imaged; however, the anticlinal structure below 2300 m and
the target zone at a lateral position of about 6500 m
and depth of 2500 m is not imaged.

![[*]](http://sepwww.stanford.edu/latex2html/movie.gif)