
![[*]](http://sepwww.stanford.edu/latex2html/prev_gr.gif)
ABSTRACTLand surveys usually have elevation changes, and this irregular topography distorts seismic data. For large topography changes and near-surface velocity comparable to subsurface velocity, static-corrections are inadequate, wavefield extrapolation is required in this situation. I present a scheme for doing migration directly from the irregular datum. The scheme can also be used for redatuming data collected at a non-flat datum to a flat datum. The reverse-time migration method is used to do the extrapolation, because it is a boundary-value problem, which naturally accommodates an irregular topography. It can handle steep dips and a general velocity model. After describing the reverse-time algorithm, I apply it to a post-stack example and show that static shifts are inadequate but migration from a non-flat datum produces a good image. I also outline the shot-profile implementation and its extension to 3-D. |
Seismic data acquired in mountainous regions are distorted because of topography. Static corrections are inadequate when the elevation changes are steep and the near-surface velocity is high, since in this case the energy does not travel vertically. In this situation, wave-equation extrapolation is more appropriate than static shift. The standard, optimized migration algorithms assume the data is recorded on a flat surface. However, when there is substantial topography migration from the irregular datum should provide an accurate image.
Several wavefield extrapolation methods are commonly used for migration, namely finite-difference methods, Kirchhoff methods, f-k methods and reverse-time migration methods. For datuming, Berryhill applied the Kirchhoff integral method to wavefield extrapolation. The method is accurate and easy to implement for constant velocity. For variable velocity medium, however, the method encounters problems associated with an approximate solution to the wave equation and problems of ray tracing in complex media. Shtivelman and Canning have presented a Kirchhoff integral scheme similar to Berryhill. Bevc implemented the datuming scheme outlined by Berryhill and designed an anti-aliased operator. McMechan and Chen and Reshef , have outlined approaches to do depth migration from irregular surfaces and McMechan and Chen incorporate receiver and source statics implicitly using reverse-time migration done via finite-differences. Reshef has presented a technique that allows extrapolation in depth from an irregular datum using downward continuation technique. Popovici applied phase-shift plus interpolation (PSPI) to perform datuming. Ji and Claerbout applied phase-shift method for datuming, but this method has difficulty in implementing lateral velocity variations.
I present a migration algorithm that can handle data collected at an irregular surface, and it is based on the extrapolation of the scalar one-way acoustic wave equation via reverse-time method. I use a pseudo-spectral approach to do reverse-time migration. The reverse-time migration method has the advantage of handling the topography naturally, since it is a boundary value method. The method can also be used for redatuming the data collected at an irregular surface to a flat datum. Once the data have been redatumed a faster migration routine could be used to do the imaging. Using synthetic data, I show that static shift is inadequate, but migration from the irregular datum produces an accurate image. Finally, I outline the implementation for shot-profiles and 3-D post-stack data. The method can handle a general velocity medium and has the ability to handle steep dips. The routines for 2-D and 3-D zero-offset modeling and migration and 2-D shot-profile migration were implemented on the Connection Machine CM-5. NUMERICAL IMPLEMENTATION
The derivation of the reverse-time migration algorithm starts with the one-way scalar wave equation
 |
(1) |
| |
(2) |
| |
(3) |
| |
(4) |
Stability and Accuracy As with any wave-propagation simulation problem on a computational grid, the effect of the grid sampling and the medium characteristics on the accuracy and stability of the numerical scheme need to be studied. Since the space derivatives are evaluated in the Fourier domain, a sampling of 2 gridpoints/wavelength is sufficient for representing the Nyquist frequency
This gives us a limit on the grid sampling based on aliasing:
| (5) |
The time-differencing which is based on a Taylor's series expansion,
has a truncation error that leads to a phase and amplitude error,
This error can be expressed in terms of a dimensionless quantity
![]() , given by
, given by
| (6) |
 |
(7) |
 |
(8) |
| (9) |
| (10) |
WAVEFIELD EXTRAPOLATION post-stack implementation The migration from non-flat datum, should be implemented in the shot-profile domain, rather than the post-stack domain, because it is difficult to obtain a stacked section when the data is distorted by topography. However I show a post-stack example because it is a first step in gaining intuition into the problems encountered with non-flat topography. I outline the shot-profile implementation in the next section.
Reverse time migration of zero-offset data can be thought of as
the process of taking
the recorded zero-offset or exploding reflector experiment, and
back propagating this wavefield back into the earth until time equals
zero, the time the "exploding reflectors" explode. Reverse time migration
proceeds by using time slices starting from the last time sample of the stacked data and going towards the first time sample (t=0) of the stacked section
as a boundary condition
for wave propagation in the specified velocity model.
The computation scheme can be summarized with the help of the schematic
in Figure ![[*]](http://sepwww.stanford.edu/latex2html/cross_ref_motif.gif) .
Start with an all-zero (x,z) plane at the bottom of the data cube and
extrapolate backward in time toward t=0 to compute snapshots of the
(x,z) plane at different times. These snapshots of the subsurface are
indicated by the horizontal planes. The direction
of extrapolation for migration is shown on
the right. At each time level include the
boundary value (x slice at z=0, for flat datum, and x
slice at z=ztopo for a non-flat datum, indicated by the dotted
line in the Figure
.
Start with an all-zero (x,z) plane at the bottom of the data cube and
extrapolate backward in time toward t=0 to compute snapshots of the
(x,z) plane at different times. These snapshots of the subsurface are
indicated by the horizontal planes. The direction
of extrapolation for migration is shown on
the right. At each time level include the
boundary value (x slice at z=0, for flat datum, and x
slice at z=ztopo for a non-flat datum, indicated by the dotted
line in the Figure ![[*]](http://sepwww.stanford.edu/latex2html/cross_ref_motif.gif) )
into the (x,z) plane from the seismic section.
The migrated section is the (x,z) plane at t=0. The extrapolation
is done via Equation 3.
Figure
)
into the (x,z) plane from the seismic section.
The migrated section is the (x,z) plane at t=0. The extrapolation
is done via Equation 3.
Figure ![[*]](http://sepwww.stanford.edu/latex2html/cross_ref_motif.gif) and Figure
and Figure ![[*]](http://sepwww.stanford.edu/latex2html/cross_ref_motif.gif) show the vertical and horizontal sections of the impulse response
of the 3-D reverse-time migration algorithm
The parameters are v=2000 m/s, dx=dy=dz=12.5 m, dt= 4ms.
The response is close to a hemi-sphere, indicating its ability
to handle high dips.
show the vertical and horizontal sections of the impulse response
of the 3-D reverse-time migration algorithm
The parameters are v=2000 m/s, dx=dy=dz=12.5 m, dt= 4ms.
The response is close to a hemi-sphere, indicating its ability
to handle high dips.
Modeling proceeds forward in time. It starts with a reflectivity model at time zero, and the snapshots are computed for forward time propagation. At each time step the data are extracted from the snapshot, it is the x-slice corresponding to z=0 for a flat datum. For a non-flat datum the data is extracted along z defined by the topography z=ztopo.
 |
|
mig
Figure 2 Vertical section from the impulse response of the 3-D reverse-time extrapolation scheme. The operator has a high-dip accuracy. | 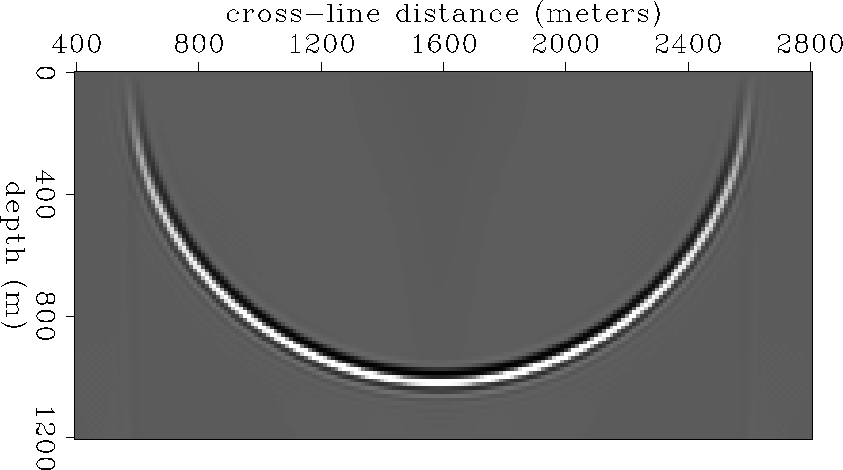 |
|
threed
Figure 3 Depth slice from the 3-D reverse-time extrapolation operator. | 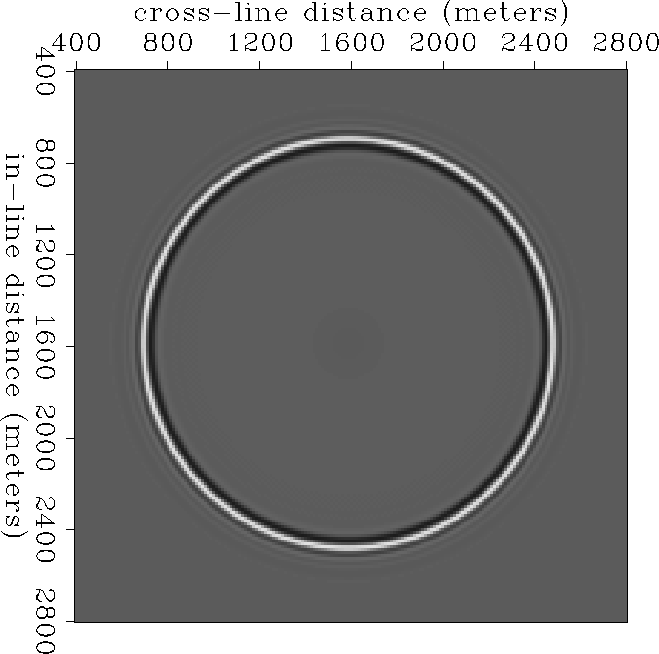 |
The method outlined in this paper can also be used to carry out datuming of the wavefield recorded at an irregular surface, to a flat surface above the recording surface using a constant velocity as suggested by Bevc . This procedure enables velocity analysis of the data by removing the distortions caused by topography. The datuming to an upward datum can be performed by, forward time extrapolation, and at each time step I include the data (x-slice) corresponding to the data recorded at that time at the lower datum. For each time step, extract the data at the upper flat datum. The forward extrapolation is run for a time greater than the recorded time at the lower datum. Once the data has been datumed to a flat surface, a faster and efficient algorithm maybe used for doing the migration. Shot Profile Implementation The shot-profile wavefield imaging consists of three steps, forward propagation of the shot wavefield, reverse propagation of receiver wavefield, and, finally, implementing the imaging condition. The shot wavefield is modeled using the differencing scheme in Equation 2. For a non-flat topography, the shot wavefield is computed from the actual source position. The receiver wavefield is backpropagated using the differencing scheme in Equation 3. For a non-flat topography, the recorded wavefield is backpropagated from the actual receiver positions (the implementation is the same as the zero-offset case shown in the previous section, except that the true velocity is used instead of half velocity), in a velocity model and it is imaged by measuring its amplitude when it is coincident with the primary shot wavefield. For shot-profile migration, the imaging condition is the time the shot wavefield takes to impinge on some boundary in the earth. At each time-step, the source and receiver wavefields are multiplied together at each grid point and the result is added to an image plane. The image plane is summed over all the time steps. This is equivalent to a zero-lag cross-correlation imaging condition.
The shot wavefield is propagated from the shot point past all the reflecting horizons of interest; this occurs forward in time. The wavefield at each time step is written out to disk. Once this is done, the recorded wavefield is propagated back towards the reflectors using the one-way wave equation, this is done backward in time. When the recorded wavefield is at the same instant of time as the forward propagated shot, the image plane starts building up. Thus the two wavefields are multiplied together and added to the result of previous time levels to extract the position of the reflectors. This proceeds until time equals zero, when all of the reflected waves have been backpropagated into the model and have imaged the shot.
The procedure can be extended to 3-D shot profiles in a straightforward
manner. However, it is expensive
in comparison to a Kirchhoff scheme. I have implemented a 3-D post-stack
algorithm on the connection machine CM-5, using the Fast Fourier
Transforms of the CM library. Figure ![[*]](http://sepwww.stanford.edu/latex2html/cross_ref_motif.gif) shows the depth
slice from an impulse response test. The operator is azimuthally isotropic.
Figure
shows the depth
slice from an impulse response test. The operator is azimuthally isotropic.
Figure ![[*]](http://sepwww.stanford.edu/latex2html/cross_ref_motif.gif) shows the vertical section through the migrated cube.
The size of the migrated cube is 256X256 surface grid and 128 depth
samples. The trace spacing is 12.5 m and the velocity is 2000 m/s.
shows the vertical section through the migrated cube.
The size of the migrated cube is 256X256 surface grid and 128 depth
samples. The trace spacing is 12.5 m and the velocity is 2000 m/s.
SYNTHETIC DATA EXAMPLES I made a test model to study the responses of migration from a non-flat datum, migration of data after static correction, and compared the two results with that of the migration from a flat datum.
 |
 |
 |
 |
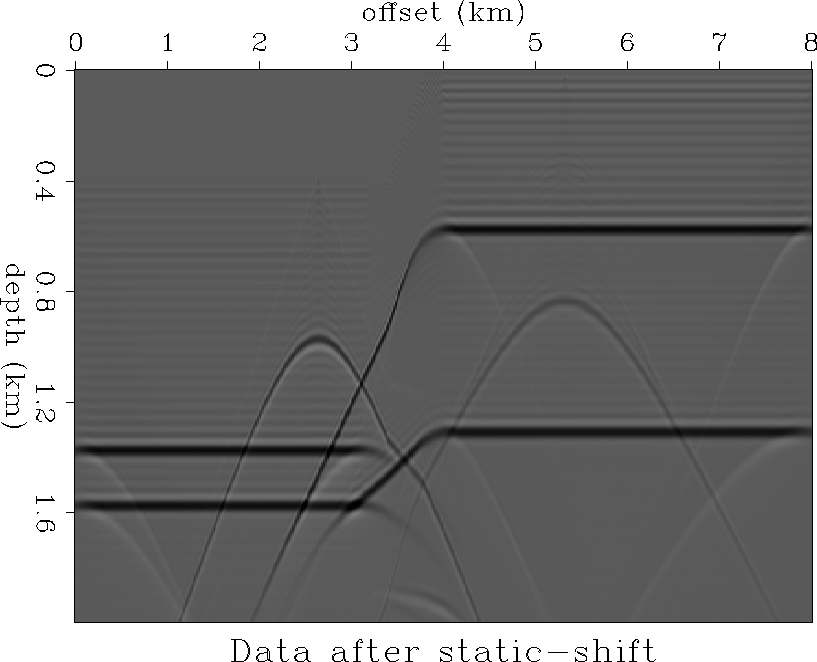 |
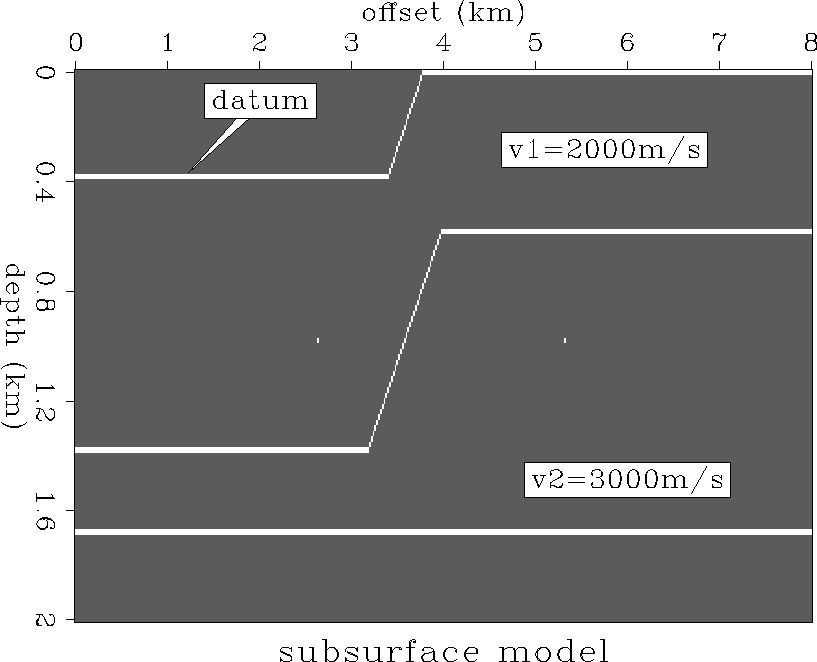
Figure ![[*]](http://sepwww.stanford.edu/latex2html/cross_ref_motif.gif) shows the model along with the non-flat
datum used in the study. There
are two diffractors on either side of the ramp-like feature. The slope
of the ramp is 45 degrees. The non-flat datum has an elevation range
of 400m. The velocity varies from 2000 m/s to 3000m/s across the ramp.
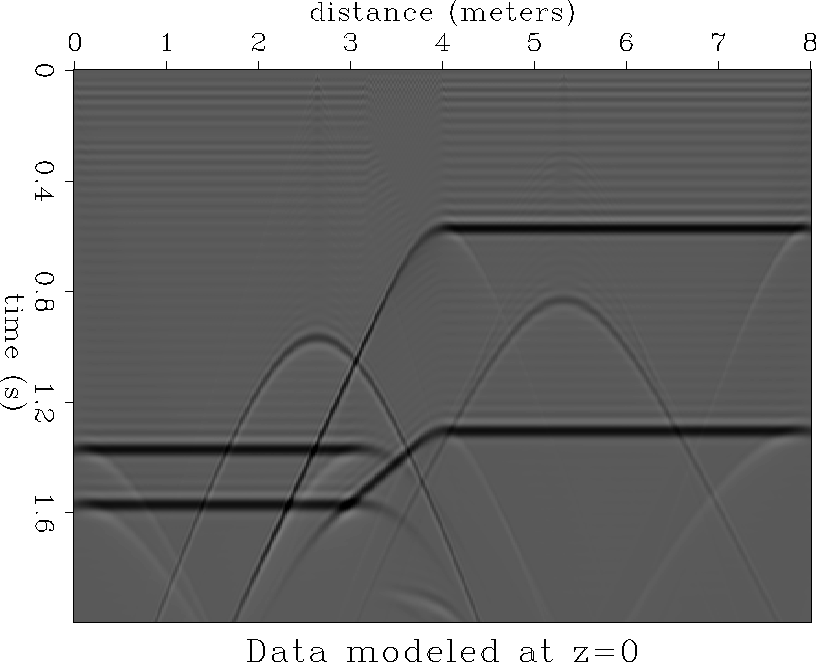
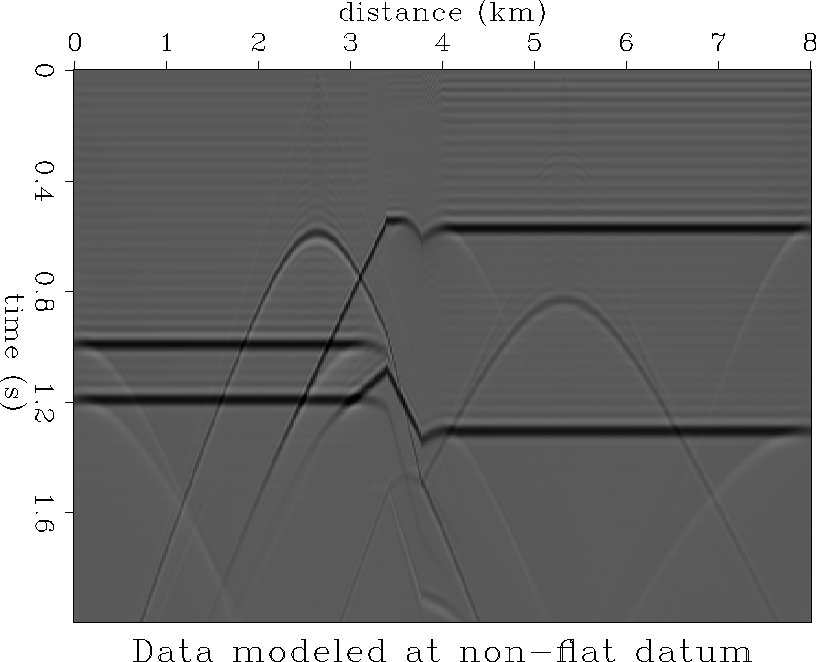
Two data sets are modeled; one was zero-offset data at the
flat surface (z=0) as shown in Figure
shows the model along with the non-flat
datum used in the study. There
are two diffractors on either side of the ramp-like feature. The slope
of the ramp is 45 degrees. The non-flat datum has an elevation range
of 400m. The velocity varies from 2000 m/s to 3000m/s across the ramp.
Two data sets are modeled; one was zero-offset data at the
flat surface (z=0) as shown in Figure ![[*]](http://sepwww.stanford.edu/latex2html/cross_ref_motif.gif) , and the second was
zero-offset data at the non-flat datum (Figure
, and the second was
zero-offset data at the non-flat datum (Figure ![[*]](http://sepwww.stanford.edu/latex2html/cross_ref_motif.gif) ). The hyperbola on
the left in Figure
). The hyperbola on
the left in Figure ![[*]](http://sepwww.stanford.edu/latex2html/cross_ref_motif.gif) now distorted because of
topography. Figure
now distorted because of
topography. Figure ![[*]](http://sepwww.stanford.edu/latex2html/cross_ref_motif.gif) shows the
data after static correction of the data modeled at the non-flat
datum.
shows the
data after static correction of the data modeled at the non-flat
datum.
 |
 |
 |
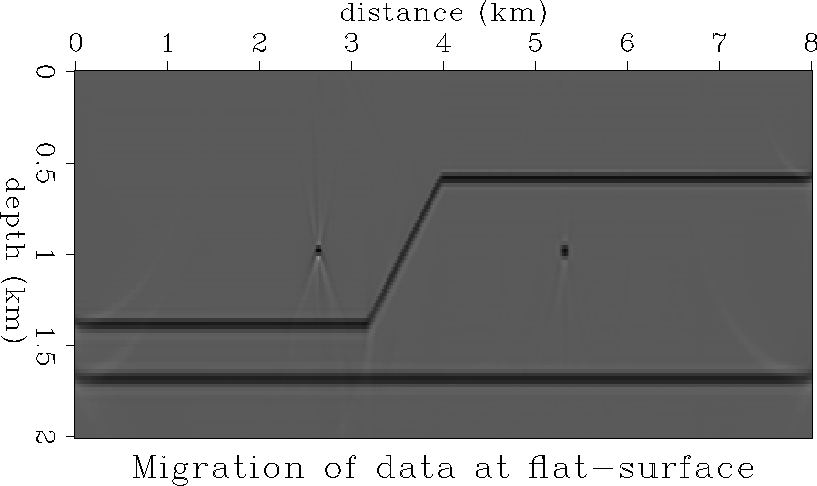
Next, the three datasets were migrated. Figure ![[*]](http://sepwww.stanford.edu/latex2html/cross_ref_motif.gif) shows the
migration
of the data from flat-datum. The events have been imaged at their proper
positions. Figure
shows the
migration
of the data from flat-datum. The events have been imaged at their proper
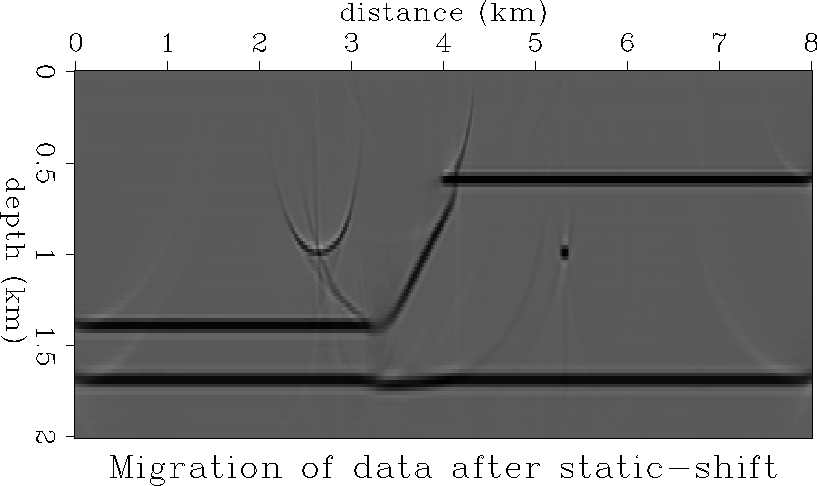
positions. Figure ![[*]](http://sepwww.stanford.edu/latex2html/cross_ref_motif.gif) shows the migration of the data collected at the
non-flat datum. The events in this case have also been moved to their
correct position. The diffractor on the left has some artifacts.
Figure
shows the migration of the data collected at the
non-flat datum. The events in this case have also been moved to their
correct position. The diffractor on the left has some artifacts.
Figure ![[*]](http://sepwww.stanford.edu/latex2html/cross_ref_motif.gif) shows the migration result of static-corrected data.
The diffractor
on the left is not completely focused, also the ramp has shifted to the
right. This can be explained by the fact, that zero-offset rays
from the slope travel at 45 degrees, whereas the static-shift is applying
a vertical correction.
Figure
shows the migration result of static-corrected data.
The diffractor
on the left is not completely focused, also the ramp has shifted to the
right. This can be explained by the fact, that zero-offset rays
from the slope travel at 45 degrees, whereas the static-shift is applying
a vertical correction.
Figure ![[*]](http://sepwww.stanford.edu/latex2html/cross_ref_motif.gif) shows the data after upward datuming to a flat datum
of the data modeled at the lower non-flat datum. Compare this with
Figure
shows the data after upward datuming to a flat datum
of the data modeled at the lower non-flat datum. Compare this with
Figure ![[*]](http://sepwww.stanford.edu/latex2html/cross_ref_motif.gif) which shows the data modeled at the flat surface.
The distortion due to the topography has been removed.
DISCUSSION AND CONCLUSIONS
The schemes presented here require a reliable estimate of the
near-surface velocity, which needs to be obtained by refraction statics
analysis or by doing a tomographic inversion for the velocity distribution
(). The datuming algorithm can be used to extrapolate the data
upwards to a flat datum assuming a velocity. This eliminates the distortions
caused by irregular topography. We can perform velocity analysis
at the flat datum to determine the near-surface velocity structure
as suggested by Bevc .
which shows the data modeled at the flat surface.
The distortion due to the topography has been removed.
DISCUSSION AND CONCLUSIONS
The schemes presented here require a reliable estimate of the
near-surface velocity, which needs to be obtained by refraction statics
analysis or by doing a tomographic inversion for the velocity distribution
(). The datuming algorithm can be used to extrapolate the data
upwards to a flat datum assuming a velocity. This eliminates the distortions
caused by irregular topography. We can perform velocity analysis
at the flat datum to determine the near-surface velocity structure
as suggested by Bevc .
I developed a scheme for zero-offset modeling, zero-offset migration, and shot-profile migration that were capable of handling irregular topography and preserving steep dips. Receiver elevation corrections are incorporated by extrapolating the recorded data from the actual receiver positions, and source elevation is accounted for by computing the excitation time from the actual source position. Static shift is shown to be inappropriate but migration from non-flat datum produces accurate images. The algorithm can be used to migrate the data directly from the flat datum, or the method can also be used to extrapolate the data to a flat datum, and a faster imaging algorithm can be used for the migration. The algorithm has high dip accuracy and can handle lateral velocity variations.
ACKNOWLEDGEMENTS This research started during my summer internship at Exxon Production Research Company. I would like to thank Dr. Y. C. Kim of Exxon for his comments and discussions. [SEP,rtm]
![[*]](http://sepwww.stanford.edu/latex2html/prev_gr.gif)