![[*]](http://sepwww.stanford.edu/latex2html/prev_gr.gif)
ABSTRACTMigration velocity analysis includes both depth-focusing analysis and residual curvature analysis of coherency panels. In either method, it is widely used for 2-D velocity analysis in regions of complex geological structures. Unfortunately, since complex structures tend to be 3-D structures, 3-D prestack depth migration is desirable. The most commonly proposed candidate is kinematic Kirchhoff migration. This paper describes how we can use it as a datuming-migrating tool, to produce migration velocity analysis panels in 3-D seismics. |
The accuracy of background velocity estimation determines the quality of migration. Conventional stacking velocity analysis based on assumptions of zero dip and laterally invariant velocity degrades in regions with complex geological structures. In such cases, depth migration is required, and migration velocity analysis is expected to provide a suitable velocity model. The 2-D version of migration velocity analysis is commonly used to solve the imaging problem in complex 2-D areas, either by focusing analysis or by residual curvature analysis on coherency panels. Both methods rely on the assumption that doing prestack depth migration with the exact velocity model will produce an image with maximum power. Both also allow for some measure of discrepancy from optimality: focusing at zero or non-zero time on focus panels, alignment or residual curvature on coherency panels. These two methods are by-products of prestack depth migration algorithms. Unfortunately, the complex structures, for which migration velocity analysis is to be used, are generally three-dimensional. For reasons of cost and volume of data involved, the traditional implementation of migration velocity analysis will not be possible in three dimensions in the near future. Therefore we have to do migration velocity analysis with the only available 3-D prestack tool: traveltime-based kinematic Kirchhoff migration. Moreover, even if this method were not the only one available in three dimensions, its flexibility would still make it the preferred multi-purpose tool.
This report first discusses the depth-focusing analysis and coherency panels in two dimensions. It then discribes a 3-D kinematic Kirchhoff migration and datuming algorithm and how to use it as a datuming-migrating tool to do 3-D focus and coherency panel velocity analysis.
DEPTH-FOCUSING ANALYSIS IN TWO DIMENSIONS
From SG migration to focusing analysis Depth-focusing analysis is derived from shot-geophone (SG) prestack depth migration. SG prestack depth migration is based on the sinking survey model, described by Doherty and Claerbout (1974). According to this model, a general datuming from depth level to depth level is done by alternating downward continuation of shot gathers and downward continuation of geophone gathers.
After the whole survey has been ``datumized'', that is, downward continued, to a given level at depth Zm, imaging is done by invoking the proper imaging principle. The imaging principle in this case states that the sample of the downward continued wavefield at zero time and offset at a given depth point is proportional to the local reflectivity at this depth point.
We also have to satisfy the quality criterion that, assuming exact velocity, all energy reflected or diffracted at the given depth point and recorded at the surface be totally and perfectly back-propagated toward the depth point, and be focused at the depth point at zero time and zero offset. In other words, if the exact velocity model is used, the migrated image will have optimal power.
When the velocity is not exact, as Doherty and Claerbout (1974) pointed out, some focusing of energy will occur at a focusing depth, and at a time different from zero. Various authors from Yilmaz and Chambers (1984) to Denelle and Jeannot (1986) have derived formulae relating exact velocity and exact depth to migration velocity, migrated depth, and focusing depth. Those formulae are derived from a 15-degree paraxial approximation, with a horizontal reflector and a constant velocity assumption. The focusing formulae are commonly used in two dimensions and turn out to be fairly valid as long as dip and lateral velocity variations are moderate.
Tracking focusing depth
The focus panels are designed to track focusing depth Zf, the
extrapolation depth where focusing of a reflector occurs.
This focusing is not necessarily observed at time zero, but it is assumed
to occur at zero offset.
At this particular extrapolation, or datuming depth Zf,
the reflector is represented by an event at residual zero-offset time
![]() , as follows:
, as follows:
| (1) |
Building focus panels To build focus panels at the selected locations, we extract the zero-offset part of the whole downward continued survey for each extrapolation step in a time window centered on time zero. The results are then converted into retarded time.
Building focus panels is often perceived as a variation of migration. It is migration with a relaxed imaging principle; the samples of the downward continued wavefield are still extracted at zero offset, but in a time window centered on zero time, instead of only at zero time.
However, for our present purpose, we consider building focus panels as a by-product of prestack datuming; we extract a part of the zero-offset component of a whole datumized survey, for all datuming steps. Since the data extracted after downward continuation is still in the time domain, we consider that there has been no imaging and no mapping from time to depth, but only datuming. We notice that focus panels can be obtained through datuming and there is no particular assumption about the method used for datuming.
It is important to note that there is no 2-D assumption in the theory of focusing analysis. In three dimensions, the theory remains unchanged, and so does the small-dip, mildly varying velocity assumption. Therefore building focus panels in three dimensions becomes a problem of doing 3-D datuming, no matter what 3-D datuming tool we choose.
COHERENCY PANELS IN TWO DIMENSIONS
Like a focusing panel, a coherency panel is a tool for migration velocity analysis, obtained from migration methods other than the SG migration. The coherency panels usually produced in two dimensions are either obtained from 2-D shot-profile migration, or from 2-D common-offset migration. In both cases, a coherency panel is produced, after migration, at a given CMP or (X,Y) surface location. This coherency panel is made of several migrated traces, aligned along an analysis axis, which is called the offset axis.
In the case of common-offset migration, the coherency panel is a CMP gather (common midpoint gather) and the offset is the original offset of the input traces. The coherency panel can be viewed as a depth coordinate equivalent of a classic CMP gather after NMO correction. In fact, the interpretation of such a coherency panel is similar to a residual NMO inversion.
In the case of shot-profile migration, the coherency panel is a true CDP gather (common depth-point gather) and the offset is the migration offset. The migration offset is defined as the offset between the shot location and the depth point location. Al-Yahya (1986) and Cox (1989) proposed a method of analysing the residual curvature exhibited in such panels.
With both types of migration, the coherency panels are built with partial image traces. The partial images come from the migration of selected subsets of the input data. The final migrated image is obtained by stacking the partial images, CDP by CDP for shot-profile migration, or CMP by CMP for common-offset migration. Of course, to yield an optimal image, all traces of a coherency panel should be stacked constructively. They should be coherent, aligned with one another along the stacking axis. Horizontal alignment of the traces in a coherency panel is the quality criterion. The residual curvature is the object of analysis.
Finally, the building of coherency panels is a by-product of shot-profile or common-offset migration, but we are given free choice of the algorithm for these migrations. There are no 2-D assumptions made either; we can construct 3-D coherency panels as soon as we have a 3-D shot-profile or common-offset migration. Since these migrations can be done by Kirchhoff methods, a low-cost kinematic Kirchhoff method is a straightforward choice for 3-D applications.
3-D KINEMATIC KIRCHHOFF MIGRATION
Finite difference algorithms work well for 2-D depth migration and its by-product, focusing analysis. But in three dimensions, the size of the computational space containing the input data requires an intractably large calculation and memory space. Moreover, when the shots and geophones are not on a regular grid, a complicated interpolation is required before migration. The migration of a whole 3-D dataset by a Kirchhoff migration still demands a huge memory space, and is very expensive as well. But the advantage of Kirchhoff methods is the ability to process any subset of input data along with any subset of output images. This means that, with Kirchhoff methods, we can break the migration problem into almost as many parts as we want: aliasing is the only limiting factor.
Since migration velocity analysis is simply taking subsets of input data (all data, shot-gathers, common-offset gathers), to produce sparse outputs (a few panels), a point-to-point algorithm like the kinematic Kirchhoff algorithm is preferable. There is an abundant literature on theory of Kirchhoff methods, so we will not detail it. In the simple kinematic versions, the complex Green's functions involved in the Kirchhoff integrals are reduced to traveltime and amplitude factors. The traveltime factor is a simple time-delay, the total traveltime computed from source to depth-point and from depth-point to receiver. The amplitude factor is an obliquity correction, multiplied by an approximate spherical divergence term, or just by 1 in the most basic kinematic form.
Traveltime computation is essential to kinematic Kirchhoff migration, and 3-D migration requires a 3-D traveltime computation.
3-D TRAVELTIME TABLES
A broad review of traveltime computation methods is done in this report, (), followed by a few examples, (). Any method applied to three dimensions is welcome, provided it is reliable and robust enough. Low cost is important too, though less so in migration velocity analysis, where input and output are far smaller than in a full prestack migration. Nevertheless, one wants to iterate the evaluation of the velocity model at reasonable cost. It may be preferable to track most energetic arrivals, rather than first arrivals. It may also be preferable to have correct rather than approximate amplitudes. However this point is probably not critical enough in migration velocity analysis to justify the extra cost. After all, the criteria used in migration velocity analysis are more kinematic than truly dynamic.
A final consideration is flexibility. Any future work using 3-D migration velocity analysis may involve traveltime computation from any source to any target. Therefore methods with constraints such as sources at the surface should be avoided.
For the moment, our choice is Podvin's method, because it exists in three dimensions and is available. Moreover, its robustness, its flexibility, and the fact that it works on a rectangular slowness grid (the most basic and common velocity model description) justify the choice until a better contender becomes available. Its weaknesses are that it is not very efficient on computer, and produces only traveltimes, mainly for first arrivals, but no amplitude and phase information. Podvin's method is briefly described in this report ().
3-D PRESTACK DATUMING
Datuming and S-G prestack migration are strongly related. As we have mentioned, S-G prestack migration is based on Claerbout's ``sinking survey'' model, and is simply a depth-step by depth-step datuming of a whole survey. Of course, the finite-difference implementation of 2-D SG migration takes full advantage of the fact that the extrapolated wavefield at step N+1 depends only, in a one-way approximation, on the wavefield extrapolated at step N. A Kirchhoff implementation of SG migration is not efficient.
The case might be different if there were only one extrapolation step, as in the datuming case, or several but to a small target, as with the focus panels. Thus it is interesting to describe 3-D datuming with regard to a kinematic Kirchhoff implementation.
Datuming is an alternating downward continuation of shot gathers and geophone gathers, from the surface to a chosen datum level. Datuming is based on Huyghens's principle. According to this principle, if we neglect any reflectivity or source term between the surface and the datum, as in a water layer, for a given shot experiment the reflected upward-propagating wavefield reaching the receivers can be seen as coming from secondary sources at datum level. The secondary sources are no more than the reflected upward-propagating wavefield passing through each point of the datum surface. In the case of a single marine shot, if we neglect water-bottom multiples, the primary wavefield recorded by the receivers is really an upward-propagating field that passes through the water bottom. Every point at the water bottom acts as a Huyghens secondary source for all the receivers of the shot-gather.
Since in a mathematical world we can play back the time, we can reverse the role and have every true receiver in the shot-gather act as a secondary source for the water bottom considered as one huge receiver array. We can compute the wavefield that has passed through the water bottom. In datuming, for every shot experiment, the receivers at the surface act as Huyghens' sources for virtual receivers on the datum. We then invoke the principle of reciprocity, which states that geophones and shots can be exchanged, in other words that a common receiver experiment is ``identical'' to the shot experiment in which the shot is put at the common receiver location and receivers replace shots.
The sections that follows detail the datuming process as a matter of alternated datuming of shot gathers and datuming of geophone gathers. From now on, we adopt the following notations:
![]() is the source at the surface.
is the source at the surface.
![]() is the receiver at the surface.
is the receiver at the surface.
![]() is a point in the subsurface, a target for the datuming.
is a point in the subsurface, a target for the datuming.
![]() is a source at datum depth zs'.
is a source at datum depth zs'.
![]() is a receiver at datum depth zs'.
is a receiver at datum depth zs'.
![]() is the
Green's function from shot
is the
Green's function from shot ![]() to depth point
to depth point ![]() .
.
![]() is the Amplitude factor of the Green's function.
It includes obliquity and spherical divergence factors.
is the Amplitude factor of the Green's function.
It includes obliquity and spherical divergence factors.
![]() is the phase of the Green's function.
is the phase of the Green's function.
In the case of only one arrival, this phase
typically takes the following form, where ![]() is the traveltime from
is the traveltime from ![]() to
to ![]() :
:
![]() =
= ![]()
The sign of the exponential, in the expression of the Green's function, depends on whether we do datuming upwards (increasing time, positive sign) or datuming downwards (decreasing time, negative sign).
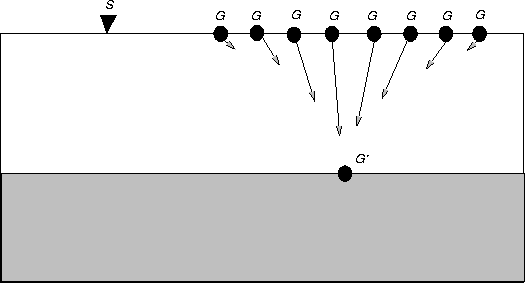
Datuming of a shot gather
The description of the datuming of a shot gather applies to any shot
or geophone gather. A shot gather is a physical experiment,
and according to reciprocity, any geophone gather is a physical experiment
too, identical to the real experiment with permutated shots and receivers.
Moreover, Claerbout (1974, 1985) showed that the process of downward continuation of shot gathers can be fully separated from the downward continuation of
geophone gathers. The reason is that the double square root operator of
the scalar wave equation does not have cross terms in ![]() , or
equivalently that the extrapolation formula is fully separable in
, or
equivalently that the extrapolation formula is fully separable in ![]() and
and ![]() .As a consequence, we can restrict our observations to the downward
continuation of one given shot gather, and later apply the same reasoning
to any shot or geophone gathers.
.As a consequence, we can restrict our observations to the downward
continuation of one given shot gather, and later apply the same reasoning
to any shot or geophone gathers.
Given a shot experiment, let ![]() be the upcoming
wavefield emitted by the source
be the upcoming
wavefield emitted by the source ![]() , and observed at receiver
, and observed at receiver ![]() .We can reconstruct the seismic traces with the same source
.We can reconstruct the seismic traces with the same source ![]() on the
acquisition surface, but with new receivers
on the
acquisition surface, but with new receivers
![]() at the datum level, as follows:
at the datum level, as follows:
| (2) |
![[*]](http://sepwww.stanford.edu/latex2html/cross_ref_motif.gif) .
.
 |
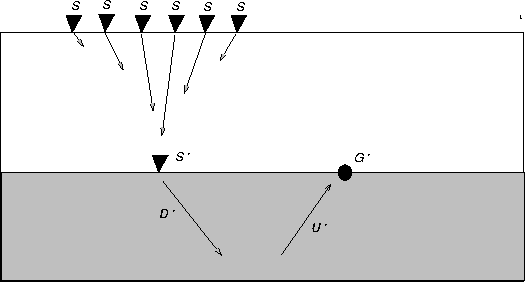
Datuming of a geophone gather
Having performed the preceding operation for every shot gather, we
then sort the traces into geophone gathers.
For every geophone gather, the geophone ![]() already lies on the datum, while the shots
already lies on the datum, while the shots ![]() still lie on the acquisition
surface.
still lie on the acquisition
surface.
We now perform the same operation that we did with the shot gathers: we extrapolate
the geophone gather to new shot locations ![]() on the datum, as indicated
by Figure
on the datum, as indicated
by Figure ![[*]](http://sepwww.stanford.edu/latex2html/cross_ref_motif.gif) .
The datumized trace for a geophone location
.
The datumized trace for a geophone location ![]() and s shot location
and s shot location
![]() , both on the datum, is then
, both on the datum, is then
| (3) |
| |
(4) |
 |
Simplification of the general datuming expression As shown in Equation 4, the general datuming expression we just derived has a theoretical form. We now introduce some simplifications to clarify its meaning and extract some interesting conclusions.
1) Replacing integrals with sums:
| |
(5) |
2) Replacing regular sampling with irregular sampling: unfortunately, the actual sampling on the field is not always regular, which has to be taken into account. Hence, this is not quite a simplification.
3) Assuming unique traveltime from point to point, The expression of the (pre-computed) Green's functions simplifies to
| (6) |
| (7) |
| (8) |
| (9) |
| (10) |
It is interesting that this expression can be translated as
1) Shifting the input trace P by
[ ![]() ], the sum of
the traveltime from the source to the new source and the traveltime from
the receiver to the new receiver.
], the sum of
the traveltime from the source to the new source and the traveltime from
the receiver to the new receiver.
2) Applying the weight ![]() .
.
3) Stacking the traces.
This process constitutes a simple kinematic Kirchhoff datuming.
If the weights ![]() and
and ![]() are set equal to one, the kinematic datuming
requires only traveltime information. It reduces to a simple shifting and
stacking process.
Although this sounds simple, in general datuming involves as many output traces
as input traces, and as many big traveltime tables.
Such general datuming is impractical and useless on the
scale of a 3-D survey. The datuming tool we have described can be useful
only for limited objective or small amount of data, for instance,
the building of
focus panels.
are set equal to one, the kinematic datuming
requires only traveltime information. It reduces to a simple shifting and
stacking process.
Although this sounds simple, in general datuming involves as many output traces
as input traces, and as many big traveltime tables.
Such general datuming is impractical and useless on the
scale of a 3-D survey. The datuming tool we have described can be useful
only for limited objective or small amount of data, for instance,
the building of
focus panels.
3-D FOCUS PANELS
Producing focus panels, either in two or three dimensions, amounts to producing zero-offset traces through prestack datuming, at a set of extrapolation depths. The focus panels, as produced by SG prestack depth migration in two dimensions, are composed of zero-offset data, saved at every extrapolation depth, for a given (sparse) number of X locations. The purpose of focusing analysis is to observe the eventual focusing of energy, occuring at the zero offset for some extrapolation depth (focusing depth), and at some non-zero time (or at zero time if optimal velocities are used in migration). Thus, in building focus panels we must keep, at every extrapolation step, the zero-offset component of the newly datumized wavefield in the vicinity of zero time.
Producing datumized zero-offset traces in three dimensions
In three dimensions, given the panel location (x0,y0),
to extract the zero-offset
output traces from the general datuming formula,
we set ![]() ,
,
with ![]() ,where
,where ![]() is a target depth point.
The desired output zero-offset trace can then be expressed directly as a
function of the input traces at any offsets, as follows,
is a target depth point.
The desired output zero-offset trace can then be expressed directly as a
function of the input traces at any offsets, as follows,
| (11) |
1) Shifting every input trace with the computed traveltime
![]() .
.
2) Applying the precomputed scaling factor
![]() .
.
3) Stacking the traces in a specified window around time
![]() .
.
Computing Green's functions for the panel location
Let us look at the traveltimes (or Green's functions) computation we have thus far assumed to be done beforehand.
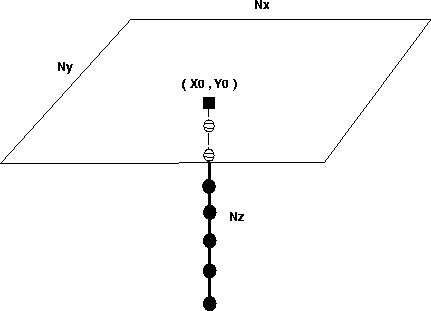
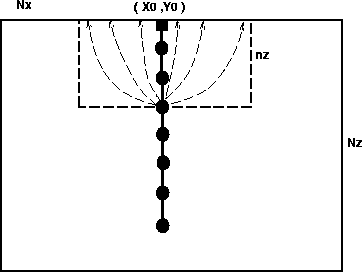
Given the panel location (x0,y0),
we need to compute the Green's function between a column of
NZ depth points (x0,y0,Z), regularly sampled in depth with step dZ
and a regular grid of surface points (x,y,Z=0), as shown in Figure ![[*]](http://sepwww.stanford.edu/latex2html/cross_ref_motif.gif) . We can make the following observations:
. We can make the following observations:
1) The surface points are limited to an area S = Nx * Ny around the panel location. The radius of this area S is something like the maximum offset of the survey, or an aperture related to the depth of the target.
2) The raypaths between the point (x0,y0,Z) and the area S can be expected to remain within the volume V= S*Z, including both the depth points and the ``aperture'' surface area S.
3) The number of depth points NZ on the
column (x0,y0) is generally far smaller than the number of
shot and receiver locations in the surface area S, sampling steps
being equal:
![]()
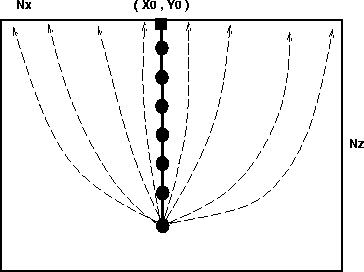
4) Finally, by taking the ``sources'' of traveltime at the depth
points instead of the surface locations, we reduce the number of ``sources''
in the traveltime computation stage, as shown in Figure ![[*]](http://sepwww.stanford.edu/latex2html/cross_ref_motif.gif) . Moreover the volume V can be
adjusted with the current source depth Z, we only need to compute
the traveltime in the layer between the depth point and the surface,
if we ignore turning waves, as shown in Figure
. Moreover the volume V can be
adjusted with the current source depth Z, we only need to compute
the traveltime in the layer between the depth point and the surface,
if we ignore turning waves, as shown in Figure ![[*]](http://sepwww.stanford.edu/latex2html/cross_ref_motif.gif) .
.
 |
 |
 |
The cost of producing focus panels
The cost of traveltime computation is proportional to the number of sources times the computation volume per source. Given the number of sources NZ, the computation volume per source is V = S*Z/dZ = Nx * Ny * Z/dZ, and the cost of traveltime computation is proportional to NZ * Nx * Ny * Z/dZ. The cost of the datuming stage itself is proportional to the number of input traces times the number of output traces. The number of input traces approximately equals to Nx * Ny * fold, where fold is the average number of traces per surface location. The number of output traces is NZ * Npanels. Finally, the cost of the datuming stage is NZ * Npanels * Nx * Ny * fold.
Given a reference cost of the chosen traveltime computation method, and the unit cost of kinematic Kirchhoff migration, one can easily compute the cost of building focus panels on a given machine. It may be reasonably cheap, and certainly several orders of magnitude cheaper than 3-D prestack migration. Thus, it is probably worth iterating upon the velocity model before launching the full 3-D prestack depth migration process.
3-D COHERENCY PANELS
For a given location (x0,y0), a coherency panel is a set of column images obtained from different subsets of input traces. A subset is, for instance, a common offset or a common shot gather.
Building a 3-D coherency panel
To build a coherency panel at location (x0,y0), given an array of
![]() and
and ![]() pertaining to the defined subset, we set the
zero-offset condition as
pertaining to the defined subset, we set the
zero-offset condition as
![]() ,
,
with ![]() ,
and the imaging condition as
t = 0.
Finally, a coherency panel is built as a migrated image, by
shifting, weighting and stacking the input traces, as follows,
,
and the imaging condition as
t = 0.
Finally, a coherency panel is built as a migrated image, by
shifting, weighting and stacking the input traces, as follows,
| (12) |
In building a coherency panel, the only real difference from producing a migrated image is that in our case the segregation of the input subsets is preserved. Of course, the output is, spatially, far sparser than that of full migration. The coherency panels are not conterminous.
The cost of producing coherency panels
The traveltime computation stage is exactly the same as in the focus panel case. In fact, it would be optimal to produce both kinds of panels at the same time. The only extra step is a further interpolation along the depth axis, because typically coherency panels have the same fine depth sampling as migrated sections.
The cost of imaging itself is proportional to the number of
input traces per subset, times the number of subsets, times the number of panels, where:
Number of input traces ![]() fold
fold
Number of output traces = Number of subsets * Number of panels
Again, once having estimated the unit cost of traveltime computation and Kirchhoff migration, one may find the building of coherency panels reasonably cheaper. It would then be worth the price of iterating upon the velocity rather than daring a 3-D prestack migration on an unchecked velocity model.
Moreover, the use of focus or coherency panels is based on the satisfaction of kinematic criteria, for which the relatively unsophisticated kinematic Kirchhoff migration might be quite sufficient. The refined tuning of Kirchhoff migration, necessary to obtain high-quality migrated images, may be unnecessary for the purpose of velocity analysis.
FUTURE STUDIES
Our immediate goal is to complete and fool-proof these tools for migration velocity analysis. Then we need to address the problems of irregular coverage and fold, and of aliasing. Though we claim that we are using kinematic, not dynamic, criteria, we will need to be careful to process amplitudes. All these problems occur with 3-D prestack kinematic migration, and will probably be addressed as this method is developed.
The focus panels and coherency panels we have described are just tools, building blocks for migration velocity analysis. Our ultimate goal is to do true 3-D migration velocity analysis. An initial step will be to check and adapt to three dimensions the existing 2-D methods. Thereafter, the specificity of three dimensions may suggest novel 3-D methods for us to develop in future studies. This would be a second step for our research.
CONCLUSIONS
We have described how kinematic migration, based on traveltime tables, can be modified into a datuming tool, to build focus and coherency panels for migration velocity analysis. Though a general 3-D datuming would be unrealistic owing to the size of the data involved, the building of focus or coherency panels is a local process, costing little in itself, and requiring little sorting of input data. These features make migration velocity analysis in three dimensions an available and affordable process.
[SEP]
![[*]](http://sepwww.stanford.edu/latex2html/prev_gr.gif)