

Next: REAL DATA EXAMPLE
Up: Cole: Statics estimation by
Previous: 2-D SYNTHETIC EXAMPLE
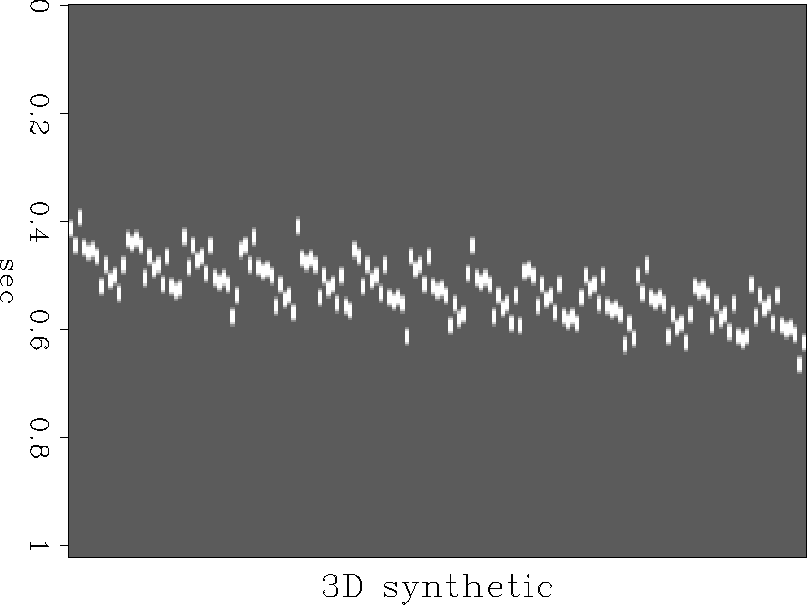
Figure ![[*]](http://sepwww.stanford.edu/latex2html/cross_ref_motif.gif) shows a 3-D version of this synthetic. There are
169 receivers in a 13 by 13 grid, the same recording geometry as the SEP
passive experiment. The 13 lines are shown in a single plot for convenience.
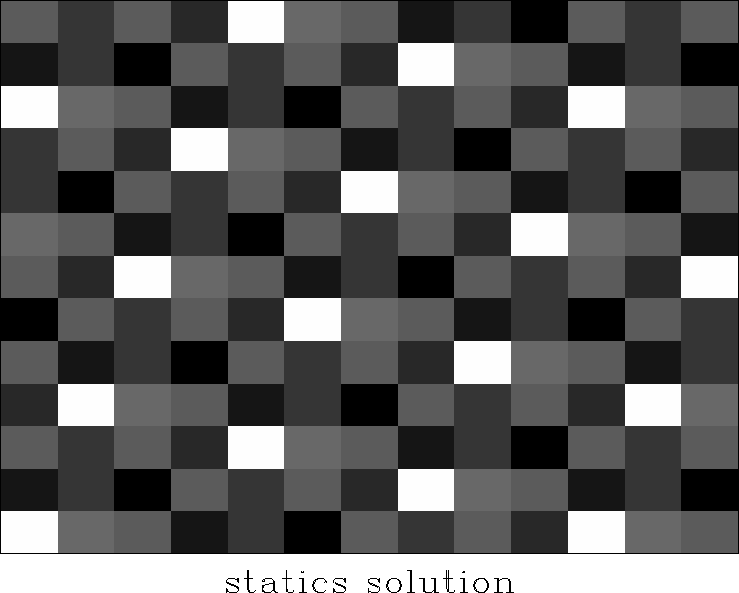
The statics that have been applied are shown in Figure
shows a 3-D version of this synthetic. There are
169 receivers in a 13 by 13 grid, the same recording geometry as the SEP
passive experiment. The 13 lines are shown in a single plot for convenience.
The statics that have been applied are shown in Figure ![[*]](http://sepwww.stanford.edu/latex2html/cross_ref_motif.gif) .
.
The difficulty in handling long-wavelength statics varies dramatically
depending on how the local slant stacks are parameterized. In
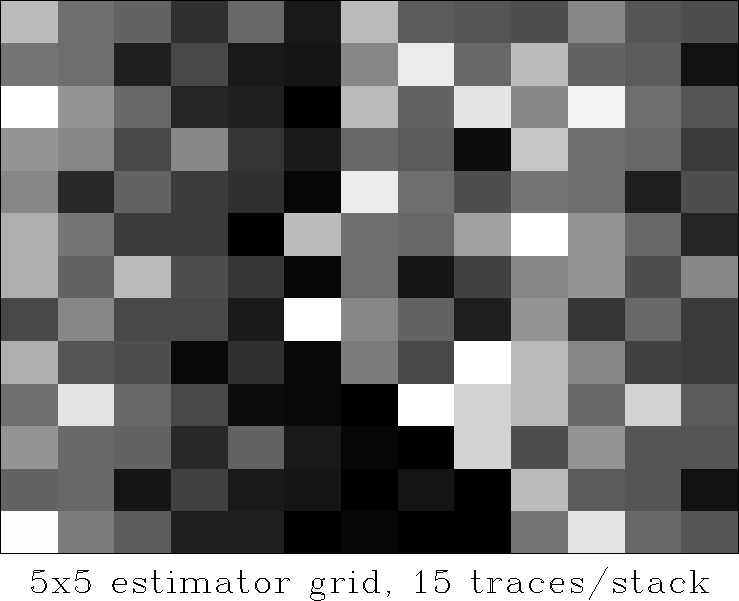
Figure ![[*]](http://sepwww.stanford.edu/latex2html/cross_ref_motif.gif) , relatively few local slant stacks were used (a
five by five grid spread evenly over the array), with 15 neighboring
traces stacked into each. This makes for little overlap between stacks.
The statics solution has a large long-wavelength component. In contrast,
in Figure
, relatively few local slant stacks were used (a
five by five grid spread evenly over the array), with 15 neighboring
traces stacked into each. This makes for little overlap between stacks.
The statics solution has a large long-wavelength component. In contrast,
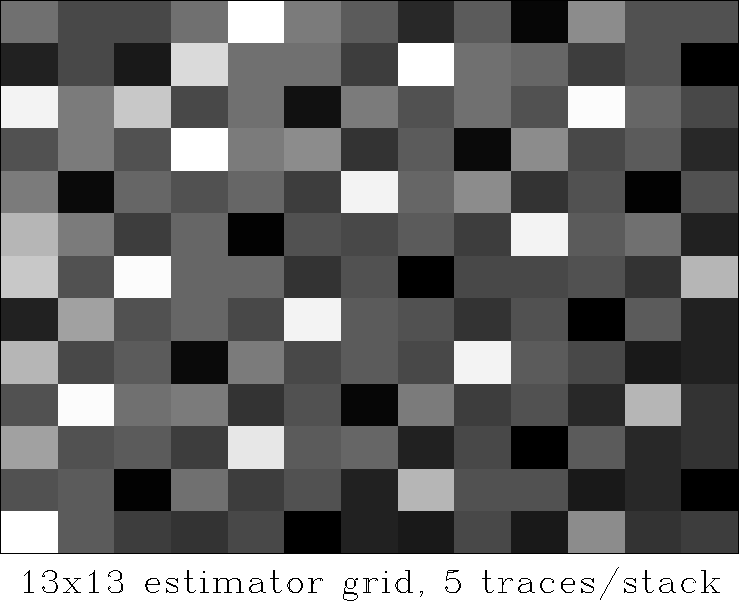
in Figure ![[*]](http://sepwww.stanford.edu/latex2html/cross_ref_motif.gif) , a local slant stack was performed at each
receiver, using 5 traces. This results in a greater degree of
overlap; most traces contribute to five or six stacks instead of two
in the previous case. The solution is less affected by the long wavelength
problem, perhaps because of the greater amount of overlap between stacks.
The data are shown in Figure
, a local slant stack was performed at each
receiver, using 5 traces. This results in a greater degree of
overlap; most traces contribute to five or six stacks instead of two
in the previous case. The solution is less affected by the long wavelength
problem, perhaps because of the greater amount of overlap between stacks.
The data are shown in Figure ![[*]](http://sepwww.stanford.edu/latex2html/cross_ref_motif.gif) with the better of the
two statics solutions applied.
with the better of the
two statics solutions applied.
syn3d
Figure 9 A 3-D synthetic containing a single dipping event, before (left) and after (right) removal of statics.

stat3d
Figure 10 Plan view of the 13 by 13
receiver array showing the known statics applied to the synthetic.
|
|  |

long3d
Figure 11 Statics estimated from
relatively few, wide-aperture local slant stacks. This solution has
a large long-wavelength component.
|
|  |

short3d
Figure 12 Using more, smaller stacks
with a greater degree of overlap gives a solution closer to the
applied statics.
|
|  |
 app3d
app3d
Figure 13 3-D synthetic after application of
statics from Figure ![[*]](http://sepwww.stanford.edu/latex2html/cross_ref_motif.gif) .
.


Next: REAL DATA EXAMPLE
Up: Cole: Statics estimation by
Previous: 2-D SYNTHETIC EXAMPLE
Stanford Exploration Project
11/16/1997
![[*]](http://sepwww.stanford.edu/latex2html/cross_ref_motif.gif) , relatively few local slant stacks were used (a
five by five grid spread evenly over the array), with 15 neighboring
traces stacked into each. This makes for little overlap between stacks.
The statics solution has a large long-wavelength component. In contrast,
in Figure
, relatively few local slant stacks were used (a
five by five grid spread evenly over the array), with 15 neighboring
traces stacked into each. This makes for little overlap between stacks.
The statics solution has a large long-wavelength component. In contrast,
in Figure ![[*]](http://sepwww.stanford.edu/latex2html/cross_ref_motif.gif) , a local slant stack was performed at each
receiver, using 5 traces. This results in a greater degree of
overlap; most traces contribute to five or six stacks instead of two
in the previous case. The solution is less affected by the long wavelength
problem, perhaps because of the greater amount of overlap between stacks.
The data are shown in Figure
, a local slant stack was performed at each
receiver, using 5 traces. This results in a greater degree of
overlap; most traces contribute to five or six stacks instead of two
in the previous case. The solution is less affected by the long wavelength
problem, perhaps because of the greater amount of overlap between stacks.
The data are shown in Figure ![[*]](http://sepwww.stanford.edu/latex2html/cross_ref_motif.gif) with the better of the
two statics solutions applied.
with the better of the
two statics solutions applied.


