

Next: REFERENCES
Up: Palacharla and Biondi: 3-D
Previous: CONCLUSIONS
Halliburton Geophysical Services kindly donated the data used in this
paper. We would like to thank Mihai Popovici for converting the data to
the seplib format and David Lumley for providing us with the velocity model
he used for his imaging results.
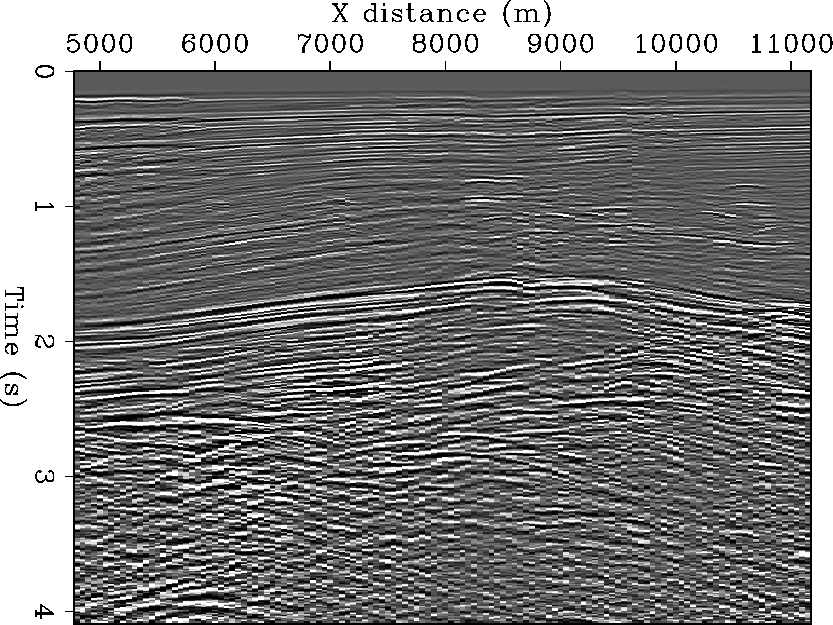
inlint20
Figure 2 Inline section taken along crossline Y=4000 meters. The section shows much
diffracted energy caused by salt-sediment interfaces.


 inlind620
Figure 3 Inline section taken from the migrated volume
at the same position as the section above
in Figure 2. The 9-9 averaged filter was
used in the migration. The diffractions are collapsed by
the migration. The fault at (x=10,800 m) is clearly visible in the
migrated section.


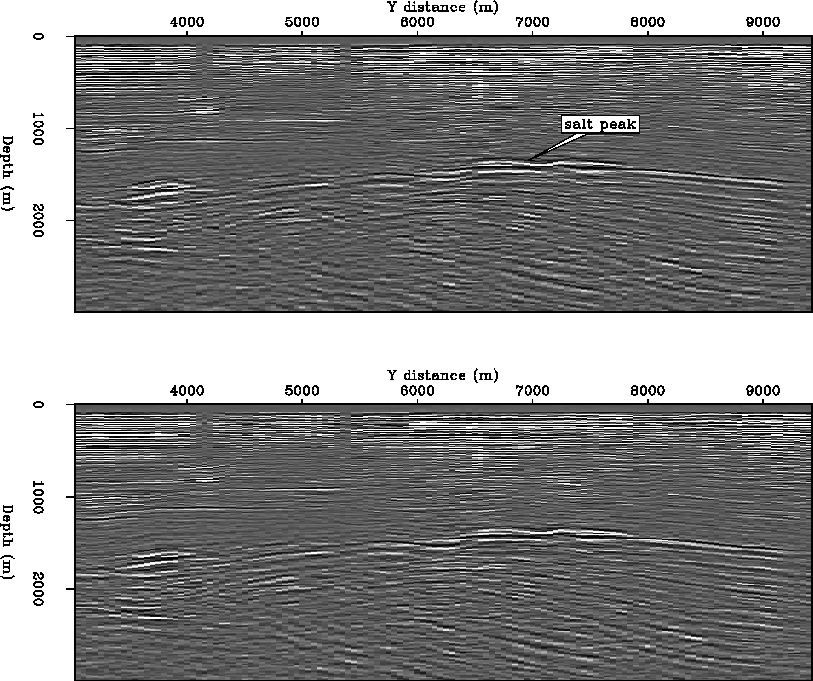
 crsl117
Figure 4 Cross slice taken along X=10800 meters. The top of the salt can be seen
at Y=7000 meters and z=1380 meters. The top section shows the output
of the nine-point filter and the bottom shows the output of the
9-9 averaged filter. Click button to see movie.


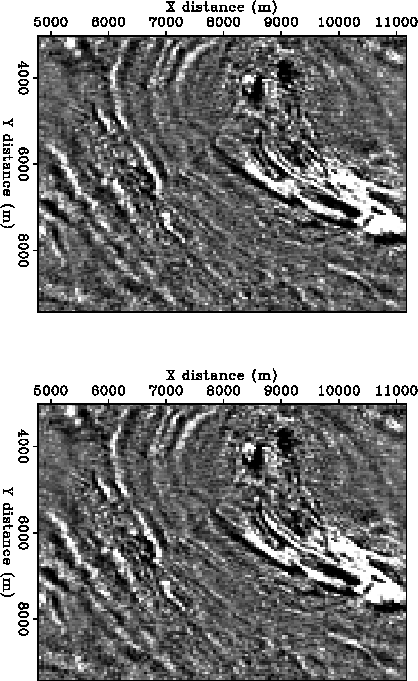
 depsl138
Figure 5 Top section, shows the depth slice at 1380 meters
from the migration implemented using the
nine-point filter, the bottom section is the corresponding one
implemented using
the 9-9 averaged filter. This depth slice shows the top of
the salt. The differences between the two depth slices are small.
Click button to see movie alternating between the two.


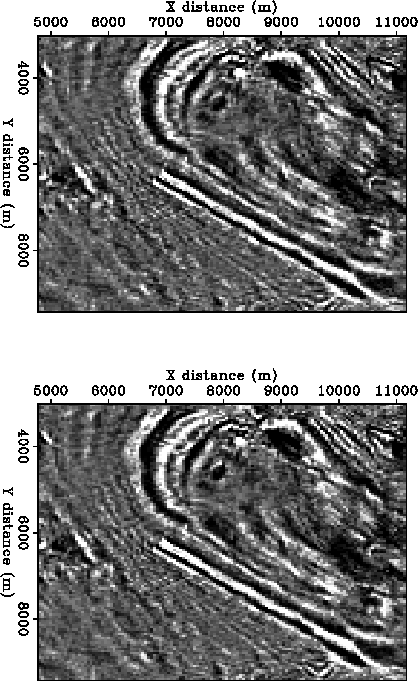
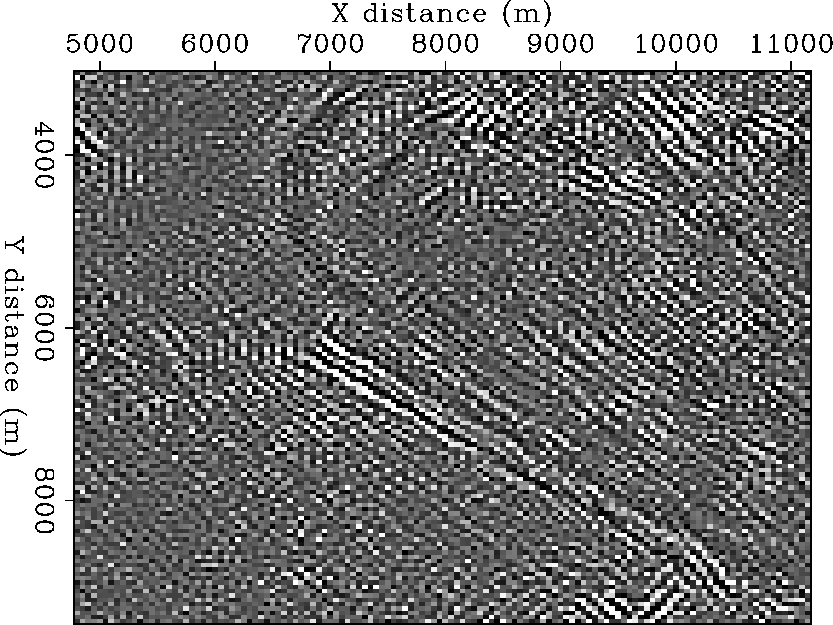
 depsl160
Figure 6 Depth slice at 1600 meters from the migration implemented
using the nine-point filter (top), the same slice from
the migration implemented with 9-9 averaged filter (bottom).
The differences are small. The difference of the sections is
shown in Figure 7. Click button to see a movie
of the two slices.


 diff160
Figure 7 Difference in the depth slices shown in Figure 6.
The peak amplitude is 0.3 times that of the peak amplitude in
the depth slices.


Next: REFERENCES
Up: Palacharla and Biondi: 3-D
Previous: CONCLUSIONS
Stanford Exploration Project
11/16/1997
