


Given the reservoir models both pre-flood and for each of two time steps of waterflood production, synthetic surface reflection seismic data can be generated for each time snapshot of production.
The synthetic seismograms are calculated based on the generalized Kirchhoff body force scattering theory of Lumley and Beydoun (1993). This theory combines Zoeppritz plane-wave reflection and Rayleigh-Sommerfeld elastic diffraction responses. The modeling theory can generate the correct AVO response for locally planar reflectors, and merge into diffraction where elastic properties vary spatially faster than a seismic wavelength. However, since the Green's tensors are WKBJ ray-valid, only primary reflections and diffractions are computed. Higher order multiple scattering or phenomena such as surface waves are not modeled.
The modeling theory is based on a volume integration of the body force
equivalent of the ![]() coefficient:
coefficient:
| |
(13) |
![]() is the P-P scattered vector wavefield measured at the receiver
position
is the P-P scattered vector wavefield measured at the receiver
position ![]() , and projected onto an arbitrary receiver component direction
, and projected onto an arbitrary receiver component direction
![]() . As and Ar are the elastic WKBJ Green's function amplitudes
from the source and receiver positions respectively, to each subsurface
scattering point
. As and Ar are the elastic WKBJ Green's function amplitudes
from the source and receiver positions respectively, to each subsurface
scattering point ![]() in the volume
in the volume ![]() . Similarly,
. Similarly,
![]() is the total traveltime from source to scatterer
to receiver. The factor
is the total traveltime from source to scatterer
to receiver. The factor ![]() is the non-geometric diffraction angle
as shown in Figure
is the non-geometric diffraction angle
as shown in Figure ![[*]](http://sepwww.stanford.edu/latex2html/cross_ref_motif.gif) , and is unity along the Snell reflection
path (specular), and variable otherwise. The
, and is unity along the Snell reflection
path (specular), and variable otherwise. The ![]() factor is the
plane-wave Zoeppritz elastic P-P reflection coefficient, and k is
the spatial wavenumber
factor is the
plane-wave Zoeppritz elastic P-P reflection coefficient, and k is
the spatial wavenumber ![]() .The incident arrival direction vector
.The incident arrival direction vector ![]() is drawn in Figure .
is drawn in Figure .
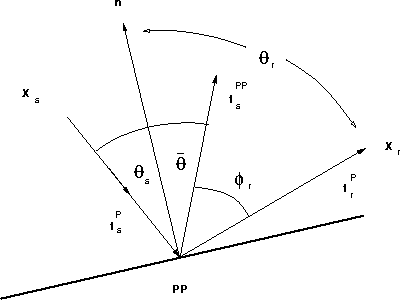 |

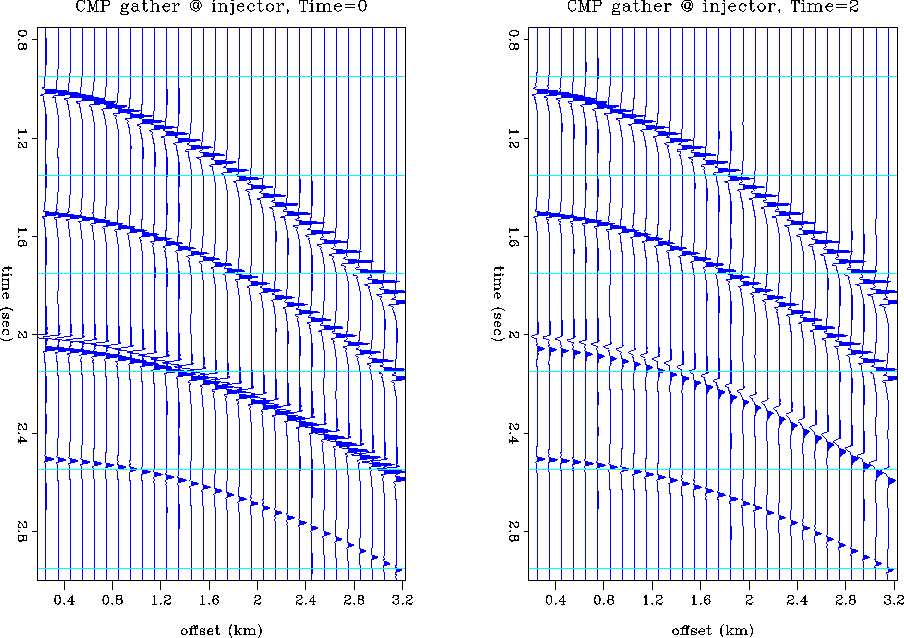
Figure shows a noise-free synthetic CMP gather located at
an injection well. The left panel is before water injection, and the right
panel is after two time steps of waterflood. The reservoir reflections
occur at and just below 2 seconds traveltime. In the pre-flood case,
there is a strong reflection and AVO response at the reservoir.
After two time steps of waterflood, the reservoir reflection is much weaker
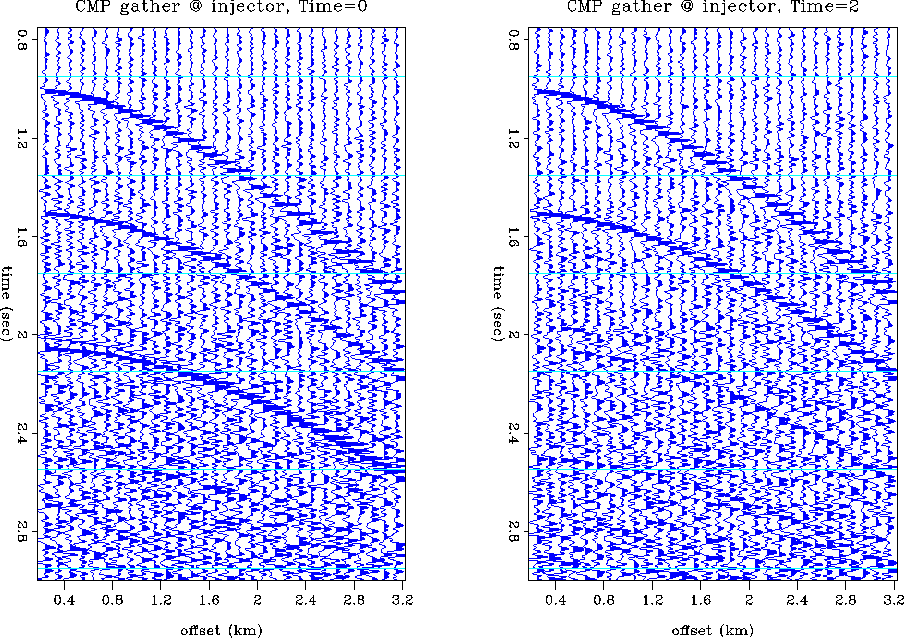
and there is almost no discernable AVO response. Figure
shows the same CMP gathers, but with a significant level of
spatially-uncorrelated Gaussian
distributed noise, filtered to the same frequency bandwidth as the
signal (10-60 Hz). The S/N ratio is about 2:1 at the reservoir reflection
in the pre-flood case, and about 1:1 after two time steps of waterflood.
It would be very difficult to detect the reservoir reflection after
waterflood alone, but the change in reflection character during time-lapse
monitoring of the production process seems quite easy to detect for this
geometry, petrophysical model, and noise distribution.
 |


 |