

Next: SYNTHETIC SEISMOGRAMS
Up: RESERVOIR MODELS
Previous: Petrophysical properties
Figure ![[*]](http://sepwww.stanford.edu/latex2html/cross_ref_motif.gif) shows an enlarged version of the reservoir zone, before
the onset of waterflooding. The top of the reservoir is at 2 km depth,
and the reservoir is 50 m thick. Figure
shows an enlarged version of the reservoir zone, before
the onset of waterflooding. The top of the reservoir is at 2 km depth,
and the reservoir is 50 m thick. Figure ![[*]](http://sepwww.stanford.edu/latex2html/cross_ref_motif.gif) shows the same
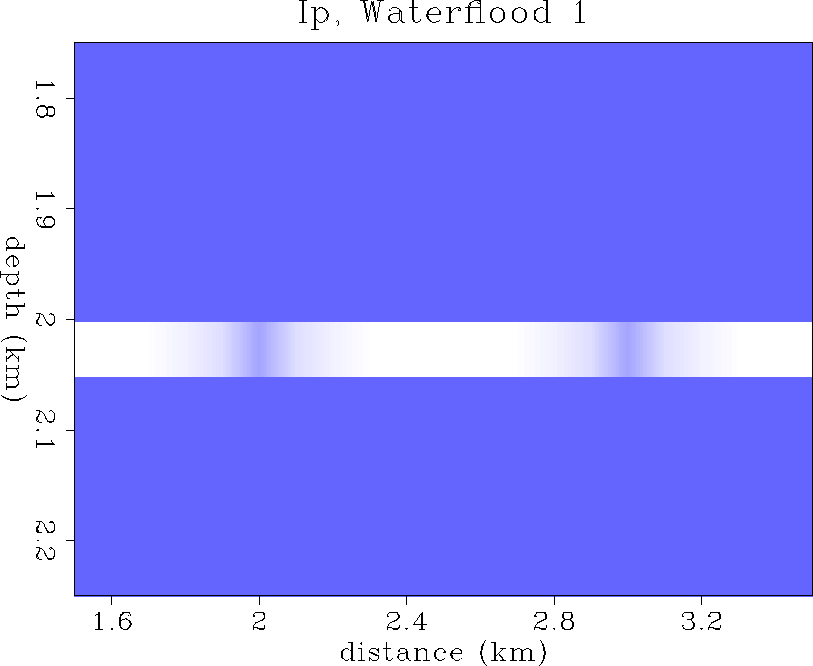
enlargement, but after one time step of water injection. The two water
injection wells are clearly located at 2 km and 3 km distance, at the
centers of the water diffusion fronts. The water invaded zones (blue/grey)
represent an increase in P impedance in the reservoir, with respect to
the initial pre-flood reservoir conditions. Figure
shows the same
enlargement, but after one time step of water injection. The two water
injection wells are clearly located at 2 km and 3 km distance, at the
centers of the water diffusion fronts. The water invaded zones (blue/grey)
represent an increase in P impedance in the reservoir, with respect to
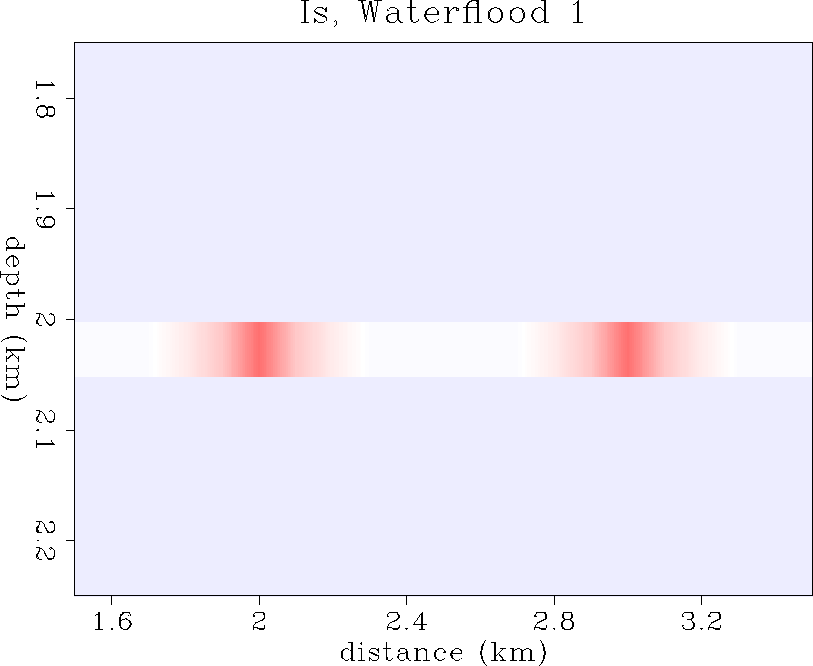
the initial pre-flood reservoir conditions. Figure ![[*]](http://sepwww.stanford.edu/latex2html/cross_ref_motif.gif) shows
the S impedance values in the reservoir after one time step of water
injection. The (red/grey) water invaded zones represent a decrease in
S impedance in the reservoir, with respect to the initial pre-flood
conditions. Since the magnitude of shear impedance change is nearly
twice as large (although opposite polarity) as the
P impedance change in the water invaded zone (Table 1),
the water injection shear impedance plume extends a larger distance away
from the wells. This implies that shear waves may be more sensitive to
monitoring water injection processes in light oil sand reservoirs
than P waves.
shows
the S impedance values in the reservoir after one time step of water
injection. The (red/grey) water invaded zones represent a decrease in
S impedance in the reservoir, with respect to the initial pre-flood
conditions. Since the magnitude of shear impedance change is nearly
twice as large (although opposite polarity) as the
P impedance change in the water invaded zone (Table 1),
the water injection shear impedance plume extends a larger distance away
from the wells. This implies that shear waves may be more sensitive to
monitoring water injection processes in light oil sand reservoirs
than P waves.
Ip1
Figure 4 Pre-flood P impedance model.


 Ip2
Ip2
Figure 5 Waterflood 1: P impedance model.


 Is2
Is2
Figure 6 Waterflood 1: S impedance model.


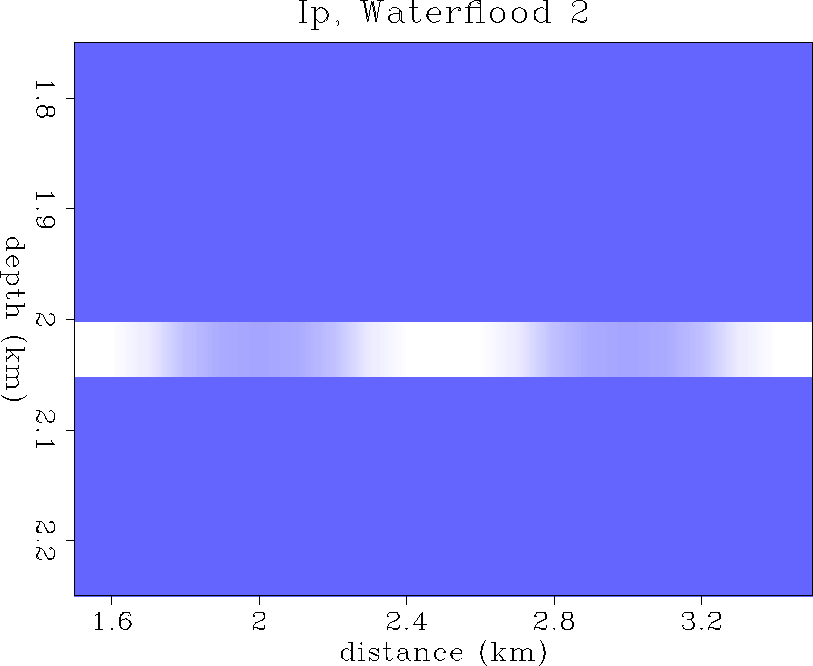
Figure ![[*]](http://sepwww.stanford.edu/latex2html/cross_ref_motif.gif) shows the reservoir P impedance map after two time steps
of waterflood. Now the P impedance diffusion front has extended about
300 m away from each injector. The (blue/grey) water invasion
zone indicates a substantial increase in P impedance within the waterflood
as compared to the initial reservoir conditions with 100% oil saturation
in place. Figure
shows the reservoir P impedance map after two time steps
of waterflood. Now the P impedance diffusion front has extended about
300 m away from each injector. The (blue/grey) water invasion
zone indicates a substantial increase in P impedance within the waterflood
as compared to the initial reservoir conditions with 100% oil saturation
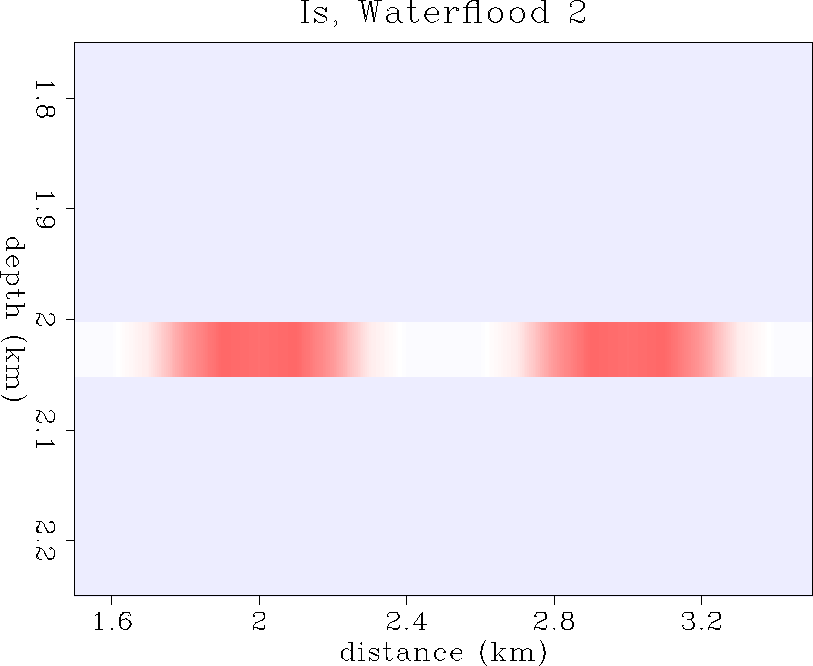
in place. Figure ![[*]](http://sepwww.stanford.edu/latex2html/cross_ref_motif.gif) shows the S impedance map after two time steps
of waterflood. Again, the S impedance front has extended about 300 m
away from each injector, and its (red/grey) color indicates
a decrease in shear impedance within the reservoir, at about twice the
magnitude of the P impedance change, compared to the initial reservoir
conditions.
shows the S impedance map after two time steps
of waterflood. Again, the S impedance front has extended about 300 m
away from each injector, and its (red/grey) color indicates
a decrease in shear impedance within the reservoir, at about twice the
magnitude of the P impedance change, compared to the initial reservoir
conditions.
Ip3
Figure 7 Waterflood 2: P impedance model.


 Is3
Is3
Figure 8 Waterflood 2: S impedance model.


Next: SYNTHETIC SEISMOGRAMS
Up: RESERVOIR MODELS
Previous: Petrophysical properties
Stanford Exploration Project
11/16/1997
![[*]](http://sepwww.stanford.edu/latex2html/cross_ref_motif.gif) shows an enlarged version of the reservoir zone, before
the onset of waterflooding. The top of the reservoir is at 2 km depth,
and the reservoir is 50 m thick. Figure
shows an enlarged version of the reservoir zone, before
the onset of waterflooding. The top of the reservoir is at 2 km depth,
and the reservoir is 50 m thick. Figure ![[*]](http://sepwww.stanford.edu/latex2html/cross_ref_motif.gif) shows the same
enlargement, but after one time step of water injection. The two water
injection wells are clearly located at 2 km and 3 km distance, at the
centers of the water diffusion fronts. The water invaded zones (blue/grey)
represent an increase in P impedance in the reservoir, with respect to
the initial pre-flood reservoir conditions. Figure
shows the same
enlargement, but after one time step of water injection. The two water
injection wells are clearly located at 2 km and 3 km distance, at the
centers of the water diffusion fronts. The water invaded zones (blue/grey)
represent an increase in P impedance in the reservoir, with respect to
the initial pre-flood reservoir conditions. Figure ![[*]](http://sepwww.stanford.edu/latex2html/cross_ref_motif.gif) shows
the S impedance values in the reservoir after one time step of water
injection. The (red/grey) water invaded zones represent a decrease in
S impedance in the reservoir, with respect to the initial pre-flood
conditions. Since the magnitude of shear impedance change is nearly
twice as large (although opposite polarity) as the
P impedance change in the water invaded zone (Table 1),
the water injection shear impedance plume extends a larger distance away
from the wells. This implies that shear waves may be more sensitive to
monitoring water injection processes in light oil sand reservoirs
than P waves.
shows
the S impedance values in the reservoir after one time step of water
injection. The (red/grey) water invaded zones represent a decrease in
S impedance in the reservoir, with respect to the initial pre-flood
conditions. Since the magnitude of shear impedance change is nearly
twice as large (although opposite polarity) as the
P impedance change in the water invaded zone (Table 1),
the water injection shear impedance plume extends a larger distance away
from the wells. This implies that shear waves may be more sensitive to
monitoring water injection processes in light oil sand reservoirs
than P waves.


