

Next: Prestack migrated sections
Up: SEISMIC DATA ANALYSIS
Previous: SEISMIC DATA ANALYSIS
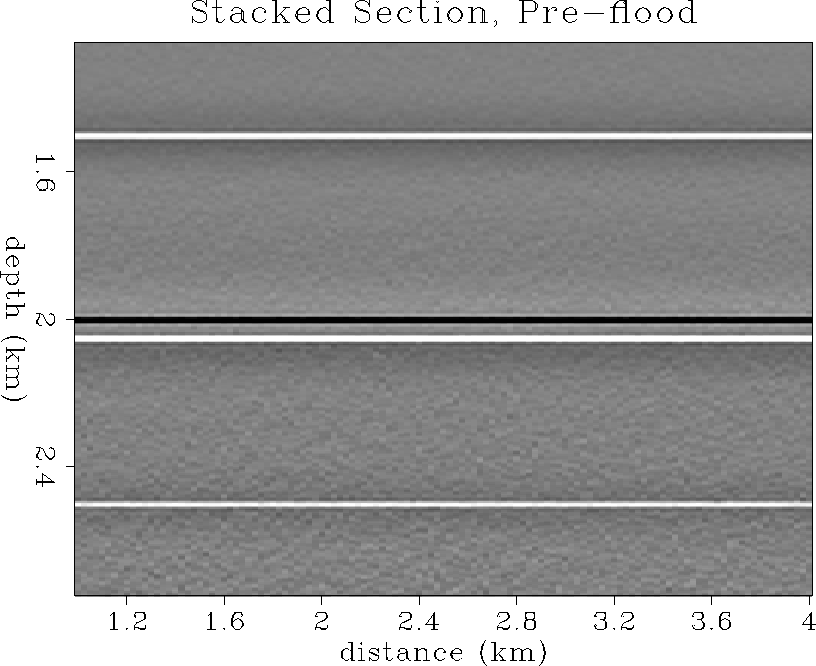
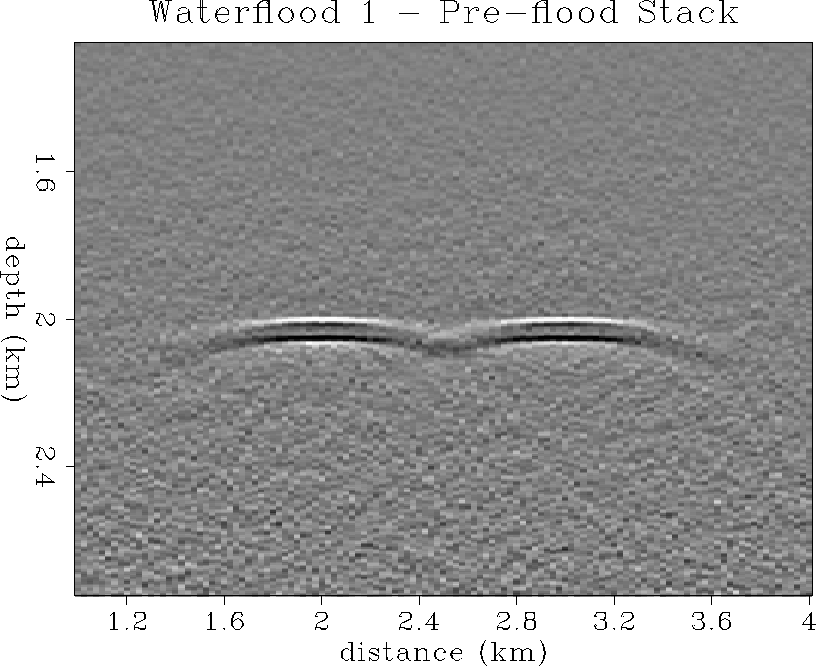
Figure ![[*]](http://sepwww.stanford.edu/latex2html/cross_ref_motif.gif) shows the stacked section from the base survey, before
any water injection. The plot is enlarged to focus on the reservoir
reflections at 2 km depth. Stacked reflection amplitudes are roughly
proportional to the P impedance contrast at a reflector, as long as no
anomalous AVO is present. Before waterflood, there are no lateral variations
in stacked reflection character along the reservoir, except those due to
the added noise. Figure
shows the stacked section from the base survey, before
any water injection. The plot is enlarged to focus on the reservoir
reflections at 2 km depth. Stacked reflection amplitudes are roughly
proportional to the P impedance contrast at a reflector, as long as no
anomalous AVO is present. Before waterflood, there are no lateral variations
in stacked reflection character along the reservoir, except those due to
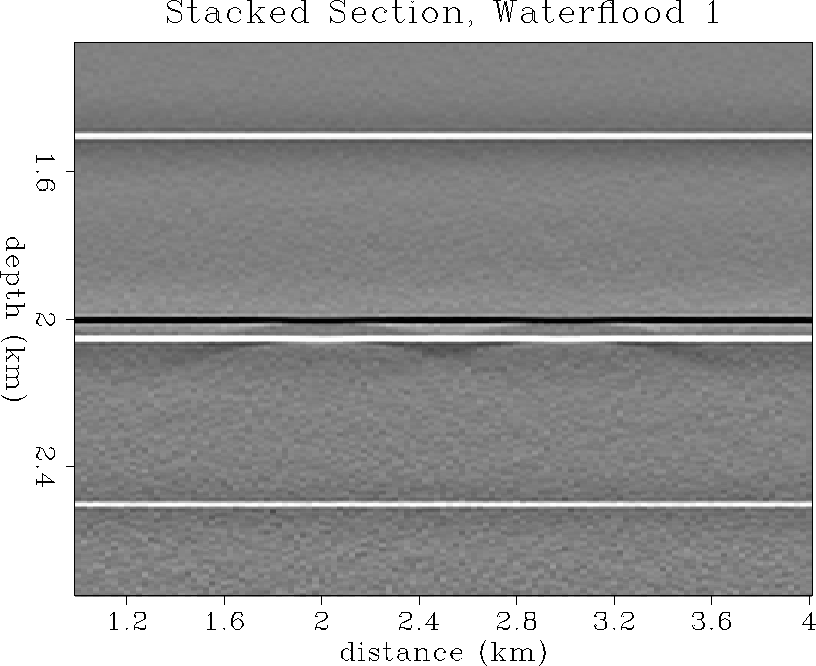
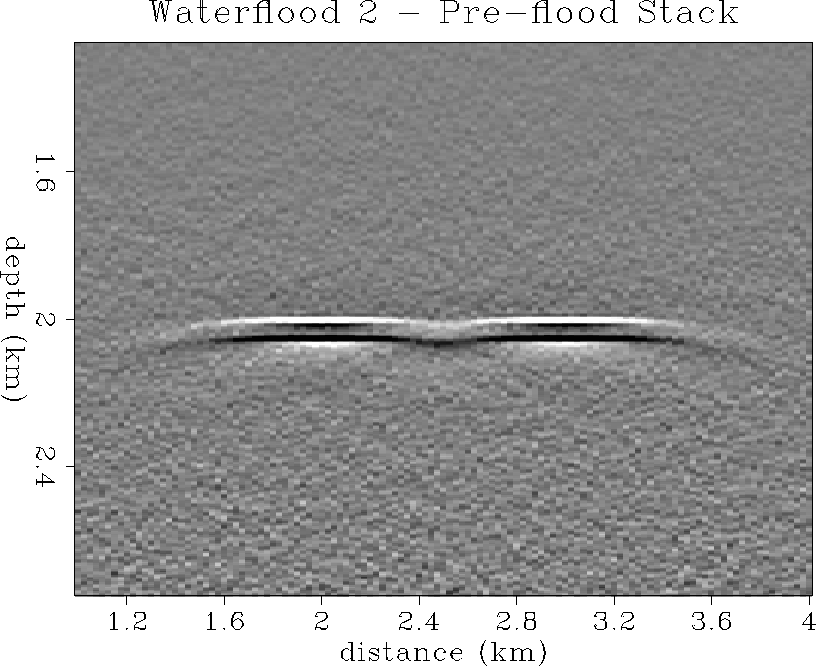
the added noise. Figure ![[*]](http://sepwww.stanford.edu/latex2html/cross_ref_motif.gif) shows the stacked section from the
survey after one time step of waterflood injection. There is some slight
dimming in the stacked reflection amplitude centered about the well locations
at 2 and 3 km distance along the line. Figure
shows the stacked section from the
survey after one time step of waterflood injection. There is some slight
dimming in the stacked reflection amplitude centered about the well locations
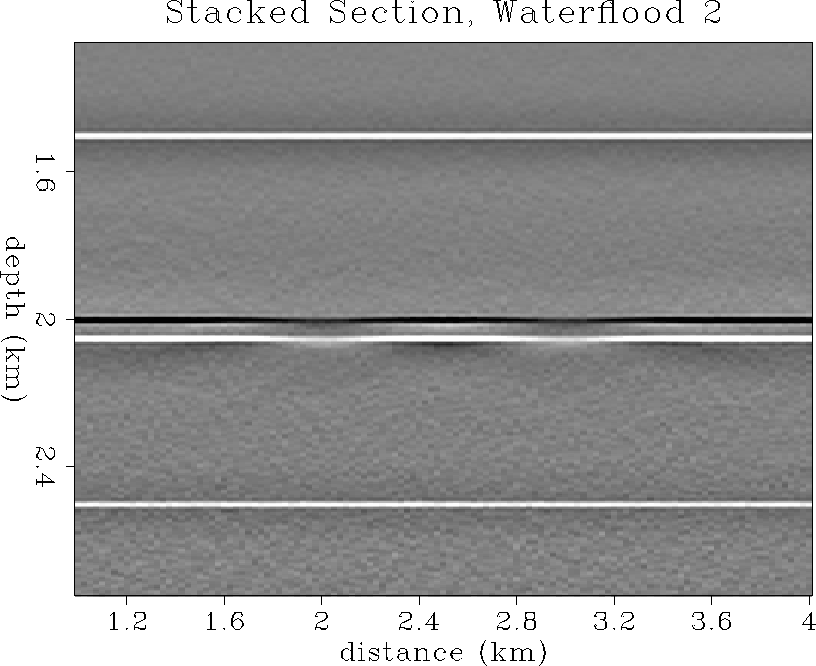
at 2 and 3 km distance along the line. Figure ![[*]](http://sepwww.stanford.edu/latex2html/cross_ref_motif.gif) shows
the stacked section from the survey generated after two time steps of
waterflood. The dimming in reflection character is more apparent than
after the first waterflood, since the water invasion zone has expanded
to a greater distance, thereby creating a larger zone of lowered
P impedance contrast. Figure
shows
the stacked section from the survey generated after two time steps of
waterflood. The dimming in reflection character is more apparent than
after the first waterflood, since the water invasion zone has expanded
to a greater distance, thereby creating a larger zone of lowered
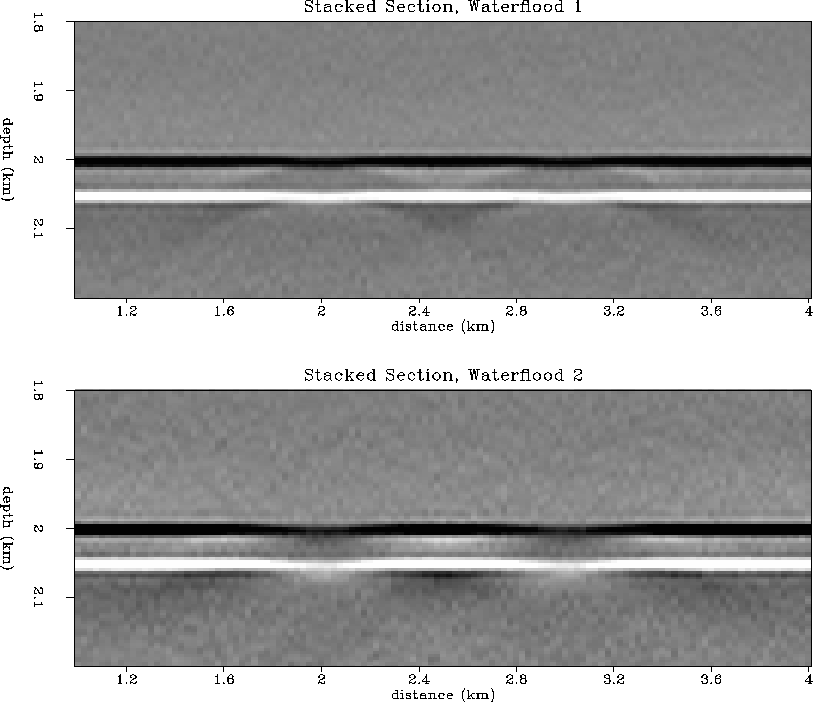
P impedance contrast. Figure ![[*]](http://sepwww.stanford.edu/latex2html/cross_ref_motif.gif) shows a close-up of the stacked
data at reservoir depth, showing more clearly the dimming and lateral
spread of stacked reflection amplitudes due to the diffusive waterflood.
shows a close-up of the stacked
data at reservoir depth, showing more clearly the dimming and lateral
spread of stacked reflection amplitudes due to the diffusive waterflood.
Figure ![[*]](http://sepwww.stanford.edu/latex2html/cross_ref_motif.gif) shows the stacked difference section, obtained by
subtracting the stacked pre-flood base section from the stacked
waterflood section after one time step. The zones of water invasion
are clearly evident in that they give rise to differential reflections,
including diffusive diffraction tails at the diffuse edge of the
water slug front. Figure
shows the stacked difference section, obtained by
subtracting the stacked pre-flood base section from the stacked
waterflood section after one time step. The zones of water invasion
are clearly evident in that they give rise to differential reflections,
including diffusive diffraction tails at the diffuse edge of the
water slug front. Figure ![[*]](http://sepwww.stanford.edu/latex2html/cross_ref_motif.gif) shows the stacked difference section
comparing the base pre-flood survey to the survey taken after two
time steps of waterflood. The water invasion zone looks larger in spatial
extent and therefore stronger in amplitude. Again, some diffuse diffractions
are evident at the edge of the waterflood. We note that the stacked sections
contain poor lateral resolution of the waterflood front because the
stacked reflections are smeared laterally over a large Fresnel zone.
Prestack wave-equation migration of the raw CMP data can collapse the
Fresnel zone down to a spatial resolution on the order of a dominant seismic
wavelength, i.e., from hundreds of meters unmigrated to tens of meters after
migration.
shows the stacked difference section
comparing the base pre-flood survey to the survey taken after two
time steps of waterflood. The water invasion zone looks larger in spatial
extent and therefore stronger in amplitude. Again, some diffuse diffractions
are evident at the edge of the waterflood. We note that the stacked sections
contain poor lateral resolution of the waterflood front because the
stacked reflections are smeared laterally over a large Fresnel zone.
Prestack wave-equation migration of the raw CMP data can collapse the
Fresnel zone down to a spatial resolution on the order of a dominant seismic
wavelength, i.e., from hundreds of meters unmigrated to tens of meters after
migration.
stack1
Figure 12 Pre-flood stacked section.


 stack2
Figure 13 Waterflood 1: stacked section.


 stack3
Figure 14 Waterflood 2: stacked section.


 stack23
Figure 15 Waterflood 1 & 2 stacked
sections.


 stack12
Figure 16 Waterflood 1 - Base stacked
difference section.


 stack13
Figure 17 Waterflood 2 - Base stacked
difference section.


Next: Prestack migrated sections
Up: SEISMIC DATA ANALYSIS
Previous: SEISMIC DATA ANALYSIS
Stanford Exploration Project
11/16/1997
![[*]](http://sepwww.stanford.edu/latex2html/cross_ref_motif.gif) shows the stacked section from the base survey, before
any water injection. The plot is enlarged to focus on the reservoir
reflections at 2 km depth. Stacked reflection amplitudes are roughly
proportional to the P impedance contrast at a reflector, as long as no
anomalous AVO is present. Before waterflood, there are no lateral variations
in stacked reflection character along the reservoir, except those due to
the added noise. Figure
shows the stacked section from the base survey, before
any water injection. The plot is enlarged to focus on the reservoir
reflections at 2 km depth. Stacked reflection amplitudes are roughly
proportional to the P impedance contrast at a reflector, as long as no
anomalous AVO is present. Before waterflood, there are no lateral variations
in stacked reflection character along the reservoir, except those due to
the added noise. Figure ![[*]](http://sepwww.stanford.edu/latex2html/cross_ref_motif.gif) shows the stacked section from the
survey after one time step of waterflood injection. There is some slight
dimming in the stacked reflection amplitude centered about the well locations
at 2 and 3 km distance along the line. Figure
shows the stacked section from the
survey after one time step of waterflood injection. There is some slight
dimming in the stacked reflection amplitude centered about the well locations
at 2 and 3 km distance along the line. Figure ![[*]](http://sepwww.stanford.edu/latex2html/cross_ref_motif.gif) shows
the stacked section from the survey generated after two time steps of
waterflood. The dimming in reflection character is more apparent than
after the first waterflood, since the water invasion zone has expanded
to a greater distance, thereby creating a larger zone of lowered
P impedance contrast. Figure
shows
the stacked section from the survey generated after two time steps of
waterflood. The dimming in reflection character is more apparent than
after the first waterflood, since the water invasion zone has expanded
to a greater distance, thereby creating a larger zone of lowered
P impedance contrast. Figure ![[*]](http://sepwww.stanford.edu/latex2html/cross_ref_motif.gif) shows a close-up of the stacked
data at reservoir depth, showing more clearly the dimming and lateral
spread of stacked reflection amplitudes due to the diffusive waterflood.
shows a close-up of the stacked
data at reservoir depth, showing more clearly the dimming and lateral
spread of stacked reflection amplitudes due to the diffusive waterflood.
