

Next: Prestack impedance inversions
Up: SEISMIC DATA ANALYSIS
Previous: Stacked sections
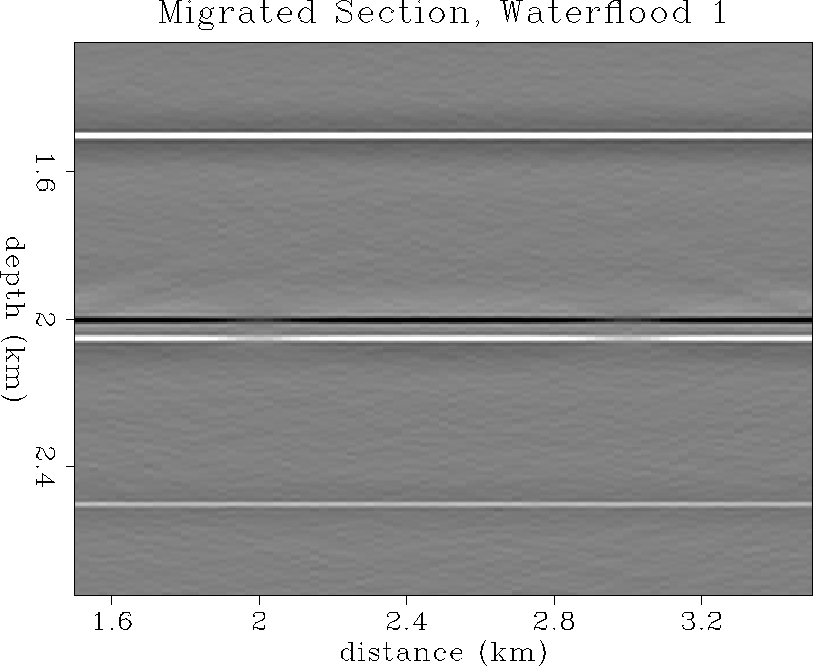
Figure ![[*]](http://sepwww.stanford.edu/latex2html/cross_ref_motif.gif) shows the prestack migrated section corresponding to the
survey after the first time step of waterflood. Figure
shows the prestack migrated section corresponding to the
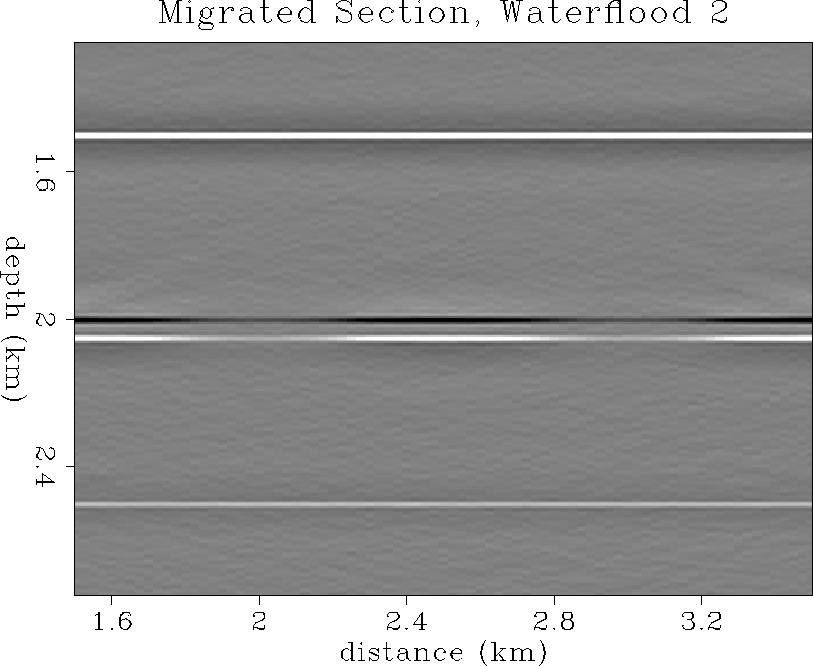
survey after the first time step of waterflood. Figure ![[*]](http://sepwww.stanford.edu/latex2html/cross_ref_motif.gif) shows
the same for the survey after two time steps of waterflood. The dimming of
the reflection events at the reservoir depths of 2 km is imaged more clearly
than on the stacked sections, and the lateral and vertical resolution
is better. This increase in apparent resolution results from
the Fresnel zones having been collapsed to a spatial
wavelength, and the diffraction tails having been correctly positioned at the
diffuse edges of the water invaded zone.
shows
the same for the survey after two time steps of waterflood. The dimming of
the reflection events at the reservoir depths of 2 km is imaged more clearly
than on the stacked sections, and the lateral and vertical resolution
is better. This increase in apparent resolution results from
the Fresnel zones having been collapsed to a spatial
wavelength, and the diffraction tails having been correctly positioned at the
diffuse edges of the water invaded zone.
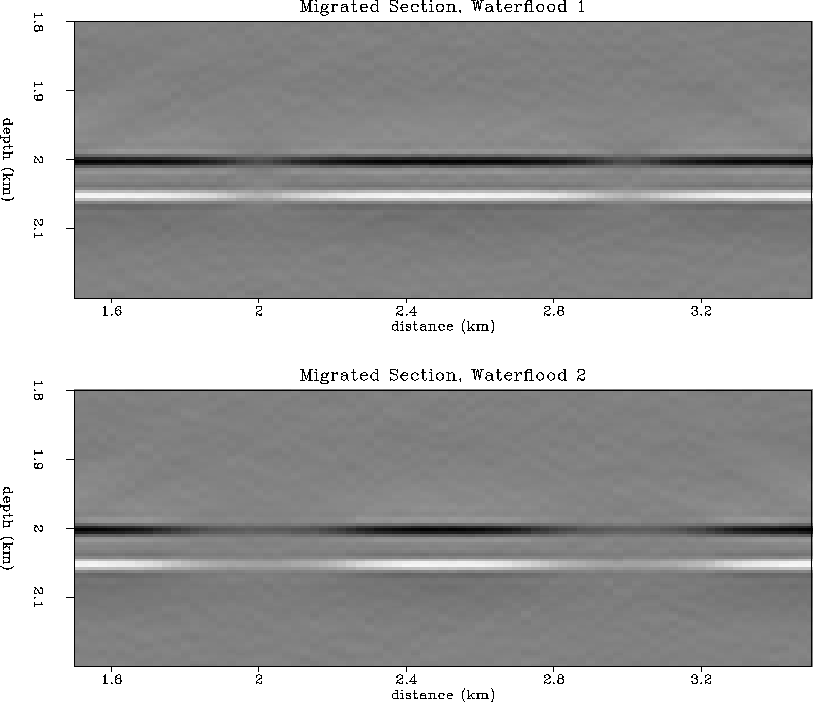
Figure ![[*]](http://sepwww.stanford.edu/latex2html/cross_ref_motif.gif) shows a close up of the reservoir zone prestack migrations
after one and two time steps of waterflood. This plot should be compared
with the stacked section counterpart in Figure
shows a close up of the reservoir zone prestack migrations
after one and two time steps of waterflood. This plot should be compared
with the stacked section counterpart in Figure ![[*]](http://sepwww.stanford.edu/latex2html/cross_ref_motif.gif) . The prestack
migrated images show more correct amplitude variation and lateral extent
than the stacked images, as is physically intuitive.
. The prestack
migrated images show more correct amplitude variation and lateral extent
than the stacked images, as is physically intuitive.
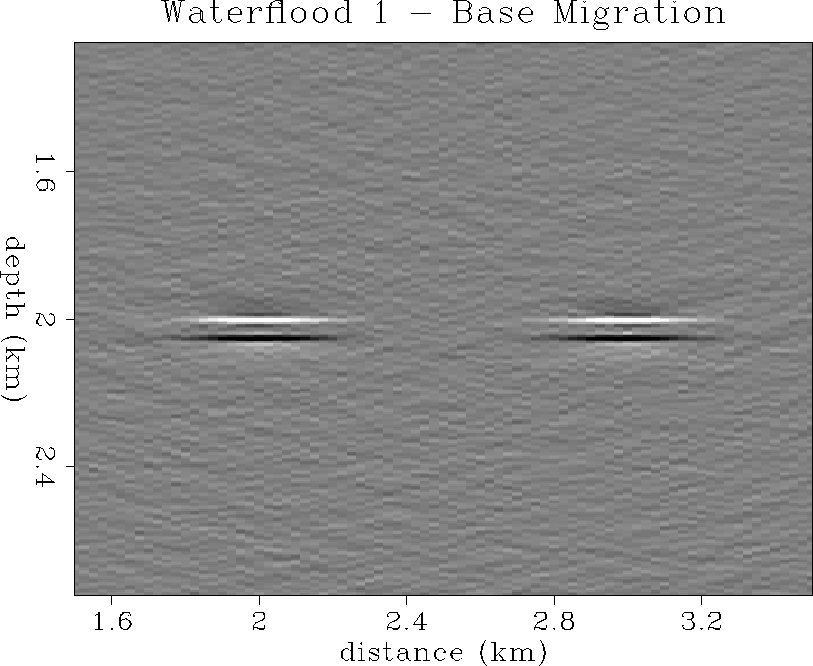
Figure ![[*]](http://sepwww.stanford.edu/latex2html/cross_ref_motif.gif) shows the difference section of the prestack migrated
sections before and after one time step of water injection. This figure
can be compared directly to the stacked section counterpart of Figure
shows the difference section of the prestack migrated
sections before and after one time step of water injection. This figure
can be compared directly to the stacked section counterpart of Figure
![[*]](http://sepwww.stanford.edu/latex2html/cross_ref_motif.gif) . Note that the diffraction tails have been collapsed, and
the spatial resolution is good enough to closely match the true extent
of the P impedance water invasion zone as depicted in the true model
of Figures
. Note that the diffraction tails have been collapsed, and
the spatial resolution is good enough to closely match the true extent
of the P impedance water invasion zone as depicted in the true model
of Figures ![[*]](http://sepwww.stanford.edu/latex2html/cross_ref_motif.gif) and
and ![[*]](http://sepwww.stanford.edu/latex2html/cross_ref_motif.gif) .
Figure
.
Figure ![[*]](http://sepwww.stanford.edu/latex2html/cross_ref_motif.gif) shows the difference section of the prestack migrated
sections before and after two time steps of water injection. This figure
can be compared directly to the stacked section counterpart of Figure
shows the difference section of the prestack migrated
sections before and after two time steps of water injection. This figure
can be compared directly to the stacked section counterpart of Figure
![[*]](http://sepwww.stanford.edu/latex2html/cross_ref_motif.gif) . Again, the diffractions have been correctly positioned to
image the diffusive edge of the water slug, and the spatial resolution
has increased from a Fresnel width down to a seismic wavelength. Note that
the boundary of the migrated reflections match closely with the P and S
impedance fronts in the true models of Figures
. Again, the diffractions have been correctly positioned to
image the diffusive edge of the water slug, and the spatial resolution
has increased from a Fresnel width down to a seismic wavelength. Note that
the boundary of the migrated reflections match closely with the P and S
impedance fronts in the true models of Figures ![[*]](http://sepwww.stanford.edu/latex2html/cross_ref_motif.gif) and
and ![[*]](http://sepwww.stanford.edu/latex2html/cross_ref_motif.gif) .
.
mig2
Figure 18 Waterflood 1: migrated section.


 mig3
mig3
Figure 19 Waterflood 2: migrated section.


 mig23
mig23
Figure 20 Waterflood 1 & 2:
migrated sections.


 mig12
mig12
Figure 21 Waterflood 1 - Base migrated
difference section.


 mig13
mig13
Figure 22 Waterflood 2 - Base migrated
difference section.


Next: Prestack impedance inversions
Up: SEISMIC DATA ANALYSIS
Previous: Stacked sections
Stanford Exploration Project
11/16/1997
![[*]](http://sepwww.stanford.edu/latex2html/cross_ref_motif.gif) shows the prestack migrated section corresponding to the
survey after the first time step of waterflood. Figure
shows the prestack migrated section corresponding to the
survey after the first time step of waterflood. Figure ![[*]](http://sepwww.stanford.edu/latex2html/cross_ref_motif.gif) shows
the same for the survey after two time steps of waterflood. The dimming of
the reflection events at the reservoir depths of 2 km is imaged more clearly
than on the stacked sections, and the lateral and vertical resolution
is better. This increase in apparent resolution results from
the Fresnel zones having been collapsed to a spatial
wavelength, and the diffraction tails having been correctly positioned at the
diffuse edges of the water invaded zone.
shows
the same for the survey after two time steps of waterflood. The dimming of
the reflection events at the reservoir depths of 2 km is imaged more clearly
than on the stacked sections, and the lateral and vertical resolution
is better. This increase in apparent resolution results from
the Fresnel zones having been collapsed to a spatial
wavelength, and the diffraction tails having been correctly positioned at the
diffuse edges of the water invaded zone.


