

Next: CONCLUSIONS
Up: Introduction
Previous: Integration order
I can not compare impulse responses in constant offset sections
because the MZO extracted from prestack migration
includes an integration over the offset variable.
The reason why I cannot just inverse Fourier transform in
offset coordinates is explained in detail in the companion
paper (Popovici, 1993). On short, the remapping of
the field  performs implicitly a summation over the offset.
Therefore I compare the stacked output of the MZO in Fourier
domain (applied to each constant offset section) and the
output of the MZO extracted from prestack-migration applied
to the whole prestack data cube. I will call the MZO defined
in Fourier domain: FT-MZO, and the MZO extracted from prestack
migration: Ps-MZO.
The first model is a diffractor situated at a depth of 600 meters.
The velocity used is 2000 m/s and the number of offsets is 64.
The maximum half-offset h is 1575 meters.
The modeling was done by calculating the travel-time from
source to diffractor and back to receiver, and assigning to each
midpoint an amplitude equal to the product

where tsrc is the travel-time from source to the
diffractor and trec is the travel-time from the
diffractor to the receiver.
The NMO applied to the constant-offset sections prior
to processing via Hale's or Zhang's DMO has a Jacobian equal
to

I compare the results obtained with and without applying
the spherical divergence correction.
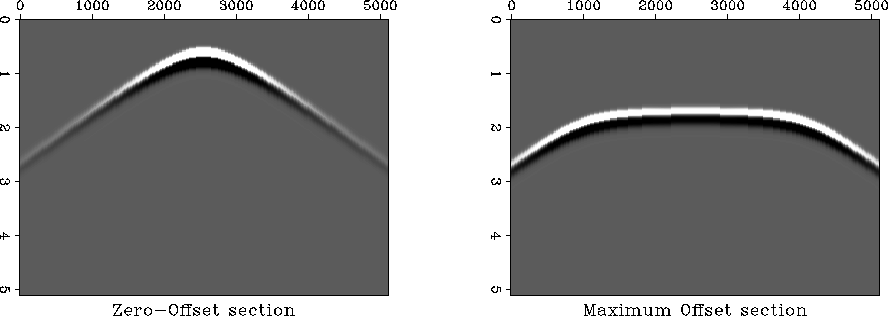
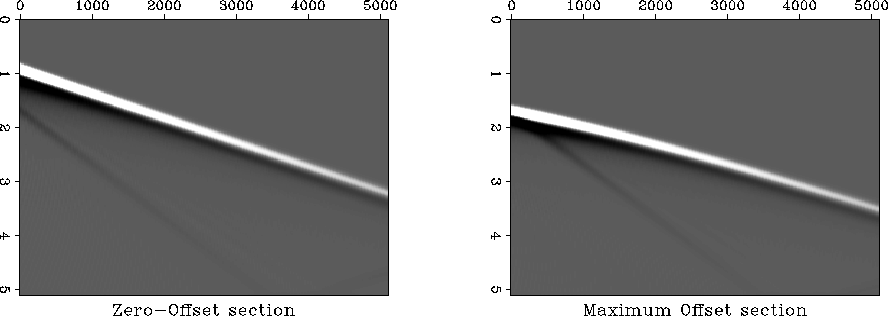
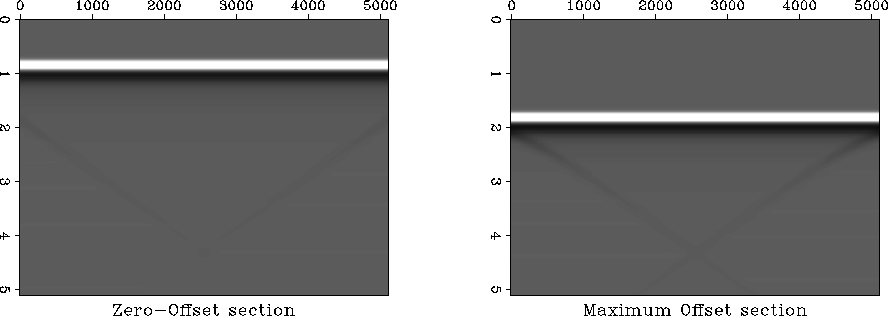
Figure ![[*]](http://sepwww.stanford.edu/latex2html/cross_ref_motif.gif) shows the first and last panel in the
prestack data cube corresponding to the zero-offset and the
maximum-offset common-midpoint (CMP) sections.
Figure
shows the first and last panel in the
prestack data cube corresponding to the zero-offset and the
maximum-offset common-midpoint (CMP) sections.
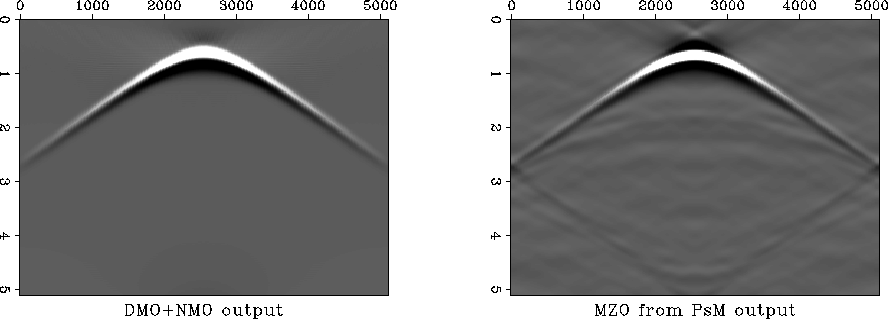
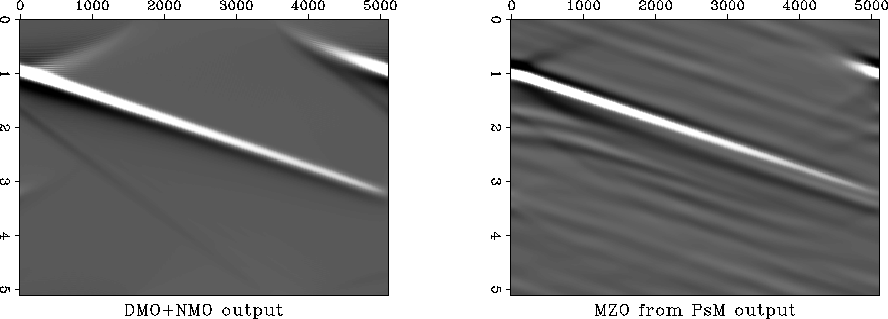
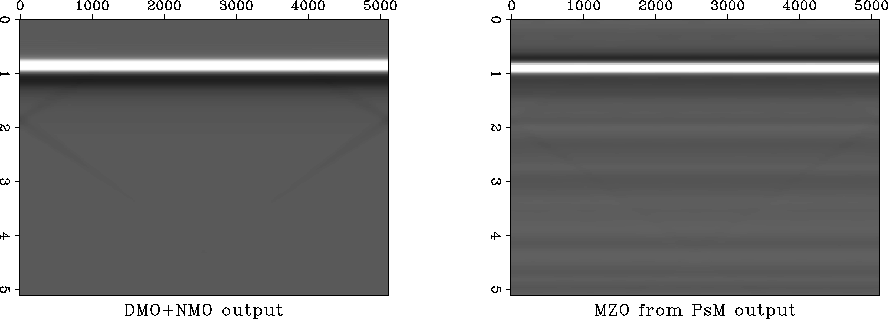
Figure ![[*]](http://sepwww.stanford.edu/latex2html/cross_ref_motif.gif) shows the output of the two MZO algorithms.
Figure
shows the output of the two MZO algorithms.
Figure ![[*]](http://sepwww.stanford.edu/latex2html/cross_ref_motif.gif) a shows the FT-MZO after stacking
all independent offsets and Figure
a shows the FT-MZO after stacking
all independent offsets and Figure ![[*]](http://sepwww.stanford.edu/latex2html/cross_ref_motif.gif) b shows
the output of applying
Ps-MZO to the entire prestack data cube.
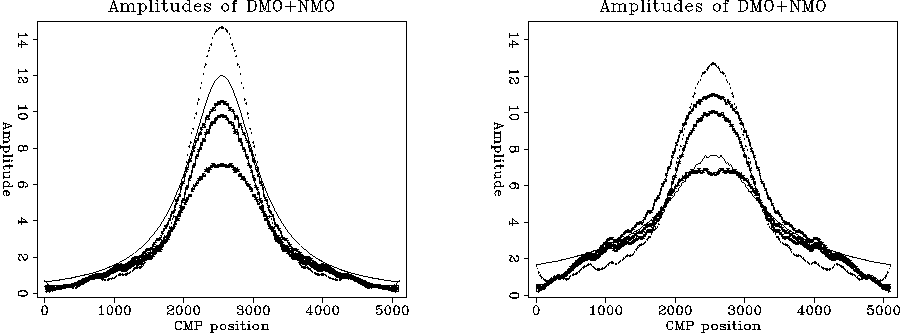
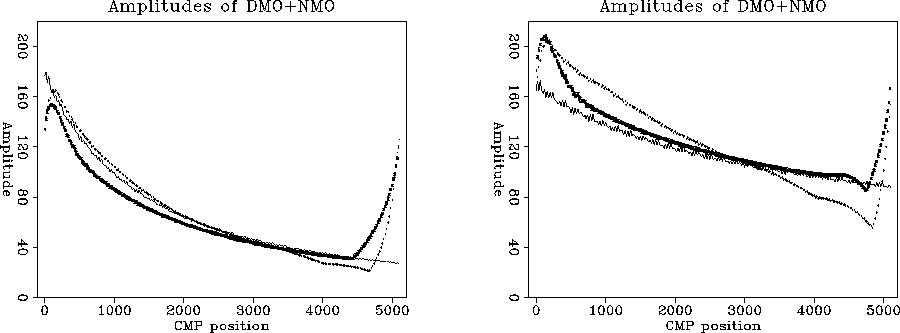
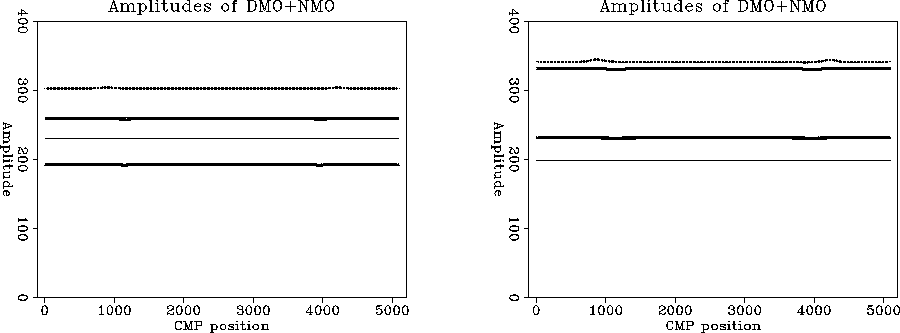
While in both cases the kinematics are the same, the
maximum amplitudes along the zero-offset hyperbola shown in
Figure
b shows
the output of applying
Ps-MZO to the entire prestack data cube.
While in both cases the kinematics are the same, the
maximum amplitudes along the zero-offset hyperbola shown in
Figure ![[*]](http://sepwww.stanford.edu/latex2html/cross_ref_motif.gif) a show there are significant differences
between the two algorithms.
The highest amplitude curve in Figure
a show there are significant differences
between the two algorithms.
The highest amplitude curve in Figure ![[*]](http://sepwww.stanford.edu/latex2html/cross_ref_motif.gif) a belongs
to the Ps-MZO section, followed by the original zero-offset
model, Zhang's DMO, Hale's DMO and FT-MZO. I expected
the FT-MZO to follow exactly Zhang's curve as it actually
happens for the dipping reflector in Figure
a belongs
to the Ps-MZO section, followed by the original zero-offset
model, Zhang's DMO, Hale's DMO and FT-MZO. I expected
the FT-MZO to follow exactly Zhang's curve as it actually
happens for the dipping reflector in Figure ![[*]](http://sepwww.stanford.edu/latex2html/cross_ref_motif.gif) where the two curves practically coincide.
Figure
where the two curves practically coincide.
Figure ![[*]](http://sepwww.stanford.edu/latex2html/cross_ref_motif.gif) b shows results obtained when applying
the spherical divergence correction.
Figure
b shows results obtained when applying
the spherical divergence correction.
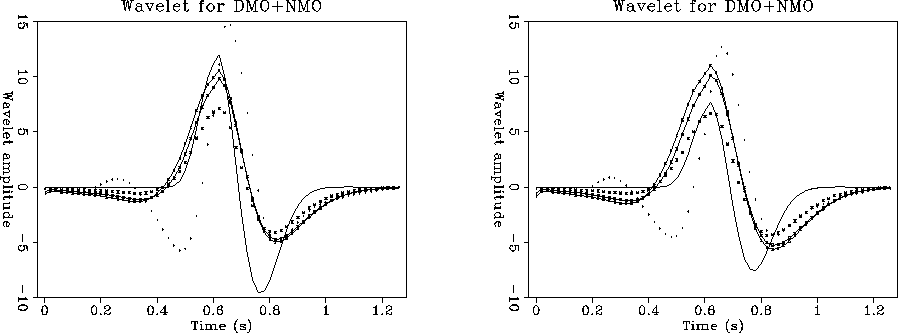
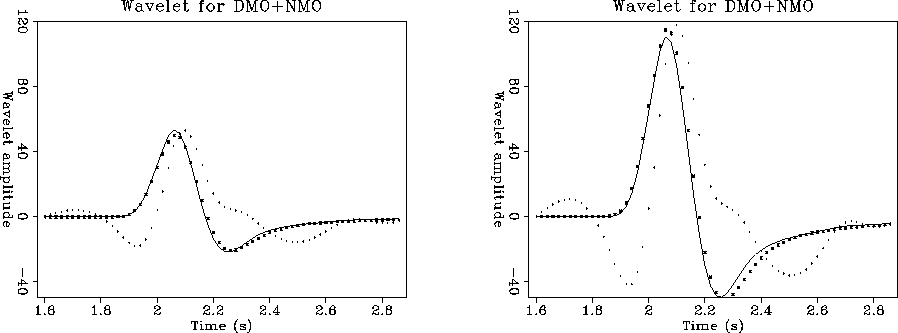
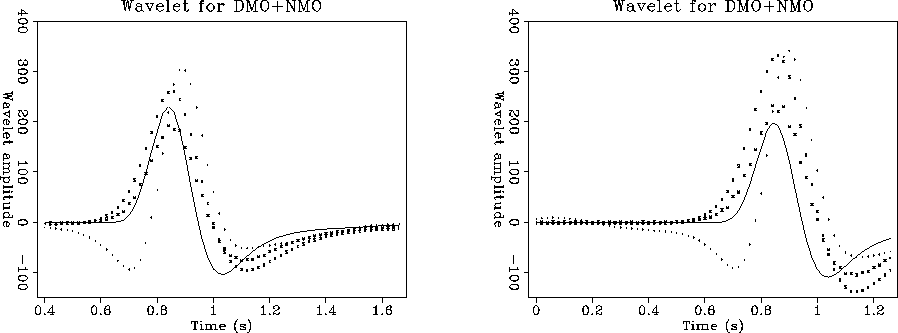
Figure ![[*]](http://sepwww.stanford.edu/latex2html/cross_ref_motif.gif) compares the wavelets obtained after MZO.
For each method I selected the trace passing through the CMP above
the diffractor. Figure
compares the wavelets obtained after MZO.
For each method I selected the trace passing through the CMP above
the diffractor. Figure ![[*]](http://sepwww.stanford.edu/latex2html/cross_ref_motif.gif) b has spherical divergence
applied. As Hale's DMO curve always follows Zhang's DMO curve but
at a lower amplitude, I removed this curve from the next comparisons,
in an attempt to unclutter the figures.
b has spherical divergence
applied. As Hale's DMO curve always follows Zhang's DMO curve but
at a lower amplitude, I removed this curve from the next comparisons,
in an attempt to unclutter the figures.
The second model represents a dipping reflector through a medium with
2000 m/s velocity.
Figure ![[*]](http://sepwww.stanford.edu/latex2html/cross_ref_motif.gif) shows the first and last panel in the
prestack data cube corresponding to the zero-offset and the
maximum-offset common-midpoint (CMP) sections.
The model was produced by considering the dipping reflector
comprised of diffractors, each modeled separately.
Figure
shows the first and last panel in the
prestack data cube corresponding to the zero-offset and the
maximum-offset common-midpoint (CMP) sections.
The model was produced by considering the dipping reflector
comprised of diffractors, each modeled separately.
Figure ![[*]](http://sepwww.stanford.edu/latex2html/cross_ref_motif.gif) a shows the output of the stacked FT-MZO,
while Figure
a shows the output of the stacked FT-MZO,
while Figure ![[*]](http://sepwww.stanford.edu/latex2html/cross_ref_motif.gif) b shows the output of the Ps-MZO algorithm.
Figure
b shows the output of the Ps-MZO algorithm.
Figure ![[*]](http://sepwww.stanford.edu/latex2html/cross_ref_motif.gif) shows the amplitudes along the dipping
reflector. This is the case where Zhang's amplitude curve
is superimposed on the FT-MZO curve as I expected from theory.
Figure
shows the amplitudes along the dipping
reflector. This is the case where Zhang's amplitude curve
is superimposed on the FT-MZO curve as I expected from theory.
Figure ![[*]](http://sepwww.stanford.edu/latex2html/cross_ref_motif.gif) b shows results obtained when applying
the spherical divergence correction.
The values at the sides of the figure should be discarded as
the picking algorithm I used to collect the amplitudes along
the reflector, chose the amplitudes along the artifacts
generated by spatial wraparound.
Figure
b shows results obtained when applying
the spherical divergence correction.
The values at the sides of the figure should be discarded as
the picking algorithm I used to collect the amplitudes along
the reflector, chose the amplitudes along the artifacts
generated by spatial wraparound.
Figure ![[*]](http://sepwww.stanford.edu/latex2html/cross_ref_motif.gif) compares the wavelets obtained after MZO.
For each method I selected the trace passing through the middle
of the section. Again Figure
compares the wavelets obtained after MZO.
For each method I selected the trace passing through the middle
of the section. Again Figure ![[*]](http://sepwww.stanford.edu/latex2html/cross_ref_motif.gif) b has spherical divergence
applied. Observe that in both cases the FT-DMO follows the zero-offset
original curve, while the phase of the Ps-MZO wavelet is very different.
b has spherical divergence
applied. Observe that in both cases the FT-DMO follows the zero-offset
original curve, while the phase of the Ps-MZO wavelet is very different.
The third model represent a horizontal reflector through a medium with
2000 m/s velocity.
Figure ![[*]](http://sepwww.stanford.edu/latex2html/cross_ref_motif.gif) shows the first and last panel in the
prestack data cube corresponding to the zero-offset and the
maximum-offset common-midpoint (CMP) sections.
Figure
shows the first and last panel in the
prestack data cube corresponding to the zero-offset and the
maximum-offset common-midpoint (CMP) sections.
Figure ![[*]](http://sepwww.stanford.edu/latex2html/cross_ref_motif.gif) a shows the output of the stacked FT-MZO,
while Figure
a shows the output of the stacked FT-MZO,
while Figure ![[*]](http://sepwww.stanford.edu/latex2html/cross_ref_motif.gif) b shows the output of the Ps-MZO algorithm.
Figure
b shows the output of the Ps-MZO algorithm.
Figure ![[*]](http://sepwww.stanford.edu/latex2html/cross_ref_motif.gif) shows the amplitudes along the horizontal
reflector.
Figure
shows the amplitudes along the horizontal
reflector.
Figure ![[*]](http://sepwww.stanford.edu/latex2html/cross_ref_motif.gif) b shows results obtained when applying
the spherical divergence correction.
Again the maximum amplitude corresponds to the Ps-MZO, followed
by Zhang's DMO, original zero-offset model and FT-MZO. When
spherical divergence is applied all three methods show
amplitudes higher than the original model.
Figure
b shows results obtained when applying
the spherical divergence correction.
Again the maximum amplitude corresponds to the Ps-MZO, followed
by Zhang's DMO, original zero-offset model and FT-MZO. When
spherical divergence is applied all three methods show
amplitudes higher than the original model.
Figure ![[*]](http://sepwww.stanford.edu/latex2html/cross_ref_motif.gif) compares the wavelets obtained after MZO.
For each method I selected the trace passing through the middle
of the section. Again Figure
compares the wavelets obtained after MZO.
For each method I selected the trace passing through the middle
of the section. Again Figure ![[*]](http://sepwww.stanford.edu/latex2html/cross_ref_motif.gif) b has spherical divergence
applied. While the two FT-MZO wavelets follow closely the
zero-offset original model, the phase of the
Ps-MZO wavelet is less similar.
b has spherical divergence
applied. While the two FT-MZO wavelets follow closely the
zero-offset original model, the phase of the
Ps-MZO wavelet is less similar.
I don't have a good explanation yet for the difference in amplitudes
between Zhang's DMO and FT-MZO in the case of the single
diffractor and in the case of the horizontal reflector.
A loss in amplitude in the FT-MZO methods, occurs due to stacking,
as the amplitude
of the zero-offset sections after DMO tend to decrease slightly
with the offset. This could be due to my modeling or to
the fact that the DMO Jacobian doesn't completely account
for the loss in amplitude with offset.
In think the spherical divergence correction should be part of
the DMO process and not an independent process, as it should
be dip dependent.
coFig1
Figure 3 Input to the DMO and MZO algorithms.
a. First panel in the input cube: zero-offset.
b. Last panel in the input cube: maximum-offset.


 zoFig1
Figure 4 Output of the DMO and MZO algorithms.
a. DMO+NMO.
b. MZO from Prestack Migration.


 ampDMO1
Figure 5 a. Amplitudes along the zero-offset hyperbola.
H-line: DMO via Hale after NMO. Z-line: Zhang DMO.
M-line: MZO (DMO+NMO) in Fourier domain.
Dotted-line: MZO from Prestack Migration.
Continuous line: amplitudes along original zero-offset
hyperbola.
b. Amplitudes with spherical divergence applied.
H-line: DMO via Hale after NMO. Z-line: Zhang DMO.
M-line: MZO (DMO+NMO) in Fourier domain.
Dotted-line: MZO from Prestack Migration.
Continuous line: amplitudes along original zero-offset
hyperbola.


 wavDMO1
Figure 6 a. Zero-offset wavelets through top of hyperbola.
H-line: Hale. Z-line: Zhang. M-line: MZO by FT.
Dotted-line: MZO from PsM. Continuous line: original wavelet.
b. Zero-offset wavelets with spherical divergence applied.
H-line: Hale. Z-line: Zhang. M-line: MZO by FT.
Dotted-line: MZO from PsM. Continuous line: original wavelet.


 coFig2
Figure 7 Input to the DMO and MZO algorithms.
a. First panel in the input cube: zero-offset.
b. Last panel in the input cube: maximum-offset.


 zoFig2
Figure 8 Output of the DMO and MZO algorithms.
a. DMO+NMO.
b. MZO from Prestack Migration.


 ampDMO2
Figure 9
a. Amplitudes along a dipping reflector.
Z-line: DMO via Zhang after NMO.
M-line: MZO (DMO+NMO) in Fourier domain.
Dotted-line: MZO from Prestack Migration.
Continuous line: amplitudes along
original zero-offset reflector.
b. Amplitudes with spherical divergence applied.
Z-line: DMO via Zhang after DMO.
M-line: MZO (DMO+NMO) in Fourier domain.
Dotted-line: MZO from Prestack Migration.
Continuous line: amplitudes along
original zero-offset reflector.


 wavDMO2
Figure 10
a. Zero-offset wavelets.
Z-line: Zhang. M-line: MZO by FT.
Dotted-line: MZO from PsM. Continuous line: original wavelet.
b. Zero-offset wavelets with spherical divergence applied.
Z-line: Zhang. M-line: MZO by FT.
Dotted-line: MZO from PsM. Continuous line: original wavelet.


 coFig3
Figure 11 Input to the DMO and MZO algorithms.
a. First panel in the input cube: zero-offset.
b. Last panel in the input cube: maximum-offset.


 zoFig3
Figure 12 Output of the DMO and MZO algorithms.
a. DMO+NMO.
b. MZO from Prestack Migration.


 ampDMO3
Figure 13
a. Amplitudes along a horizontal reflector.
Z-line: DMO via Zhang after NMO.
M-line: MZO (DMO+NMO) in Fourier domain.
Dotted-line: MZO from Prestack Migration.
Continuous line: amplitudes along
original zero-offset reflector.
b. Amplitudes with spherical divergence applied.
Z-line: DMO via Zhang after DMO.
M-line: MZO (DMO+NMO) in Fourier domain.
Dotted-line: MZO from Prestack Migration.
Continuous line: amplitudes along
original zero-offset reflector.


 wavDMO3
Figure 14
a. Zero-offset wavelets.
Z-line: Zhang. M-line: MZO by FT.
Dotted-line: MZO from PsM. Continuous line: original wavelet.
b. Zero-offset wavelets with spherical divergence applied.
Z-line: Zhang. M-line: MZO by FT.
Dotted-line: MZO from PsM. Continuous line: original wavelet.


Next: CONCLUSIONS
Up: Introduction
Previous: Integration order
Stanford Exploration Project
11/17/1997
![]()
![]()
![[*]](http://sepwww.stanford.edu/latex2html/cross_ref_motif.gif) shows the first and last panel in the
prestack data cube corresponding to the zero-offset and the
maximum-offset common-midpoint (CMP) sections.
Figure
shows the first and last panel in the
prestack data cube corresponding to the zero-offset and the
maximum-offset common-midpoint (CMP) sections.
Figure ![[*]](http://sepwww.stanford.edu/latex2html/cross_ref_motif.gif) shows the output of the two MZO algorithms.
Figure
shows the output of the two MZO algorithms.
Figure ![[*]](http://sepwww.stanford.edu/latex2html/cross_ref_motif.gif) a shows the FT-MZO after stacking
all independent offsets and Figure
a shows the FT-MZO after stacking
all independent offsets and Figure ![[*]](http://sepwww.stanford.edu/latex2html/cross_ref_motif.gif) b shows
the output of applying
Ps-MZO to the entire prestack data cube.
While in both cases the kinematics are the same, the
maximum amplitudes along the zero-offset hyperbola shown in
Figure
b shows
the output of applying
Ps-MZO to the entire prestack data cube.
While in both cases the kinematics are the same, the
maximum amplitudes along the zero-offset hyperbola shown in
Figure ![[*]](http://sepwww.stanford.edu/latex2html/cross_ref_motif.gif) a show there are significant differences
between the two algorithms.
The highest amplitude curve in Figure
a show there are significant differences
between the two algorithms.
The highest amplitude curve in Figure ![[*]](http://sepwww.stanford.edu/latex2html/cross_ref_motif.gif) a belongs
to the Ps-MZO section, followed by the original zero-offset
model, Zhang's DMO, Hale's DMO and FT-MZO. I expected
the FT-MZO to follow exactly Zhang's curve as it actually
happens for the dipping reflector in Figure
a belongs
to the Ps-MZO section, followed by the original zero-offset
model, Zhang's DMO, Hale's DMO and FT-MZO. I expected
the FT-MZO to follow exactly Zhang's curve as it actually
happens for the dipping reflector in Figure ![[*]](http://sepwww.stanford.edu/latex2html/cross_ref_motif.gif) where the two curves practically coincide.
Figure
where the two curves practically coincide.
Figure ![[*]](http://sepwww.stanford.edu/latex2html/cross_ref_motif.gif) b shows results obtained when applying
the spherical divergence correction.
Figure
b shows results obtained when applying
the spherical divergence correction.
Figure ![[*]](http://sepwww.stanford.edu/latex2html/cross_ref_motif.gif) compares the wavelets obtained after MZO.
For each method I selected the trace passing through the CMP above
the diffractor. Figure
compares the wavelets obtained after MZO.
For each method I selected the trace passing through the CMP above
the diffractor. Figure ![[*]](http://sepwww.stanford.edu/latex2html/cross_ref_motif.gif) b has spherical divergence
applied. As Hale's DMO curve always follows Zhang's DMO curve but
at a lower amplitude, I removed this curve from the next comparisons,
in an attempt to unclutter the figures.
b has spherical divergence
applied. As Hale's DMO curve always follows Zhang's DMO curve but
at a lower amplitude, I removed this curve from the next comparisons,
in an attempt to unclutter the figures.
![[*]](http://sepwww.stanford.edu/latex2html/cross_ref_motif.gif) shows the first and last panel in the
prestack data cube corresponding to the zero-offset and the
maximum-offset common-midpoint (CMP) sections.
The model was produced by considering the dipping reflector
comprised of diffractors, each modeled separately.
Figure
shows the first and last panel in the
prestack data cube corresponding to the zero-offset and the
maximum-offset common-midpoint (CMP) sections.
The model was produced by considering the dipping reflector
comprised of diffractors, each modeled separately.
Figure ![[*]](http://sepwww.stanford.edu/latex2html/cross_ref_motif.gif) a shows the output of the stacked FT-MZO,
while Figure
a shows the output of the stacked FT-MZO,
while Figure ![[*]](http://sepwww.stanford.edu/latex2html/cross_ref_motif.gif) b shows the output of the Ps-MZO algorithm.
Figure
b shows the output of the Ps-MZO algorithm.
Figure ![[*]](http://sepwww.stanford.edu/latex2html/cross_ref_motif.gif) shows the amplitudes along the dipping
reflector. This is the case where Zhang's amplitude curve
is superimposed on the FT-MZO curve as I expected from theory.
Figure
shows the amplitudes along the dipping
reflector. This is the case where Zhang's amplitude curve
is superimposed on the FT-MZO curve as I expected from theory.
Figure ![[*]](http://sepwww.stanford.edu/latex2html/cross_ref_motif.gif) b shows results obtained when applying
the spherical divergence correction.
The values at the sides of the figure should be discarded as
the picking algorithm I used to collect the amplitudes along
the reflector, chose the amplitudes along the artifacts
generated by spatial wraparound.
Figure
b shows results obtained when applying
the spherical divergence correction.
The values at the sides of the figure should be discarded as
the picking algorithm I used to collect the amplitudes along
the reflector, chose the amplitudes along the artifacts
generated by spatial wraparound.
Figure ![[*]](http://sepwww.stanford.edu/latex2html/cross_ref_motif.gif) compares the wavelets obtained after MZO.
For each method I selected the trace passing through the middle
of the section. Again Figure
compares the wavelets obtained after MZO.
For each method I selected the trace passing through the middle
of the section. Again Figure ![[*]](http://sepwww.stanford.edu/latex2html/cross_ref_motif.gif) b has spherical divergence
applied. Observe that in both cases the FT-DMO follows the zero-offset
original curve, while the phase of the Ps-MZO wavelet is very different.
b has spherical divergence
applied. Observe that in both cases the FT-DMO follows the zero-offset
original curve, while the phase of the Ps-MZO wavelet is very different.
![[*]](http://sepwww.stanford.edu/latex2html/cross_ref_motif.gif) shows the first and last panel in the
prestack data cube corresponding to the zero-offset and the
maximum-offset common-midpoint (CMP) sections.
Figure
shows the first and last panel in the
prestack data cube corresponding to the zero-offset and the
maximum-offset common-midpoint (CMP) sections.
Figure ![[*]](http://sepwww.stanford.edu/latex2html/cross_ref_motif.gif) a shows the output of the stacked FT-MZO,
while Figure
a shows the output of the stacked FT-MZO,
while Figure ![[*]](http://sepwww.stanford.edu/latex2html/cross_ref_motif.gif) b shows the output of the Ps-MZO algorithm.
Figure
b shows the output of the Ps-MZO algorithm.
Figure ![[*]](http://sepwww.stanford.edu/latex2html/cross_ref_motif.gif) shows the amplitudes along the horizontal
reflector.
Figure
shows the amplitudes along the horizontal
reflector.
Figure ![[*]](http://sepwww.stanford.edu/latex2html/cross_ref_motif.gif) b shows results obtained when applying
the spherical divergence correction.
Again the maximum amplitude corresponds to the Ps-MZO, followed
by Zhang's DMO, original zero-offset model and FT-MZO. When
spherical divergence is applied all three methods show
amplitudes higher than the original model.
Figure
b shows results obtained when applying
the spherical divergence correction.
Again the maximum amplitude corresponds to the Ps-MZO, followed
by Zhang's DMO, original zero-offset model and FT-MZO. When
spherical divergence is applied all three methods show
amplitudes higher than the original model.
Figure ![[*]](http://sepwww.stanford.edu/latex2html/cross_ref_motif.gif) compares the wavelets obtained after MZO.
For each method I selected the trace passing through the middle
of the section. Again Figure
compares the wavelets obtained after MZO.
For each method I selected the trace passing through the middle
of the section. Again Figure ![[*]](http://sepwww.stanford.edu/latex2html/cross_ref_motif.gif) b has spherical divergence
applied. While the two FT-MZO wavelets follow closely the
zero-offset original model, the phase of the
Ps-MZO wavelet is less similar.
b has spherical divergence
applied. While the two FT-MZO wavelets follow closely the
zero-offset original model, the phase of the
Ps-MZO wavelet is less similar.
