

Next: CONCLUSIONS
Up: Michelena: ray tracing
Previous: TWO POINT RAY TRACING
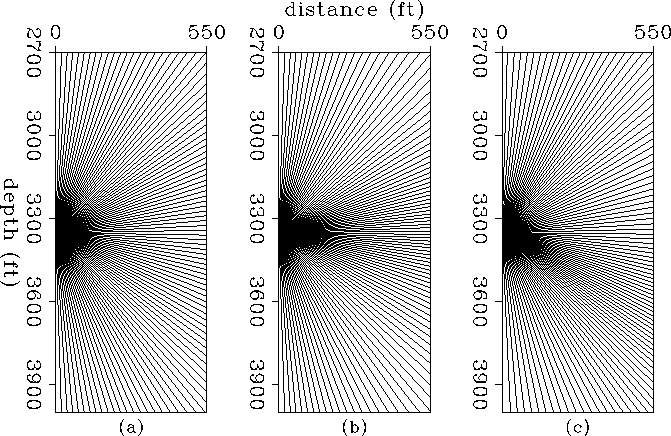
In the following examples, I will show fans of P wave
ray paths in different models
for a cross-well configuration (Appendix B shows the elastic
constants used for each model). The fans are traced at constant intervals
in
the phase angle which only correspond to constant intervals in the ray angle
when the medium is isotropic. This is shown in Figure ![[*]](http://sepwww.stanford.edu/latex2html/cross_ref_motif.gif) a, where
rays have been traced in the simplest model: homogeneous isotropic.
When the model is transversely isotropic with vertical axis of symmetry,
the density of rays changes with angle, as Figure
a, where
rays have been traced in the simplest model: homogeneous isotropic.
When the model is transversely isotropic with vertical axis of symmetry,
the density of rays changes with angle, as Figure ![[*]](http://sepwww.stanford.edu/latex2html/cross_ref_motif.gif) b shows.
Figure
b shows.
Figure ![[*]](http://sepwww.stanford.edu/latex2html/cross_ref_motif.gif) c shows the rays paths in a homogeneous
transversely isotropic
model with axis of symmetry tilted with respect to the vertical (
c shows the rays paths in a homogeneous
transversely isotropic
model with axis of symmetry tilted with respect to the vertical ( ).
If two point ray tracing for the same receiver positions
is performed in the corresponding
homogeneous models,
we won't see any difference among the three ray path diagrams because
the ray angles depend only on the relative positions of source and receivers.
The differences among the three cases will be in the traveltimes.
rays-homo
Figure 6 Ray paths in different homogeneous models for a source located at
3350 ft. (a) Isotropic. (b) Transversely isotropic with vertical
axis of symmetry. (c) Transversely isotropic with  . Note
how the density of rays changes with angles in the anisotropic models.

Models like the ones shown in Figure ![[*]](http://sepwww.stanford.edu/latex2html/cross_ref_motif.gif) may arise after
different combinations
of deposition, erosion and rotation of the layers involved. The areas
of the model that are finely layered can be modeled as homogeneous
anisotropic layers
with axis of symmetry perpendicular to the layering.
The only difference
between the two models in Figure
may arise after
different combinations
of deposition, erosion and rotation of the layers involved. The areas
of the model that are finely layered can be modeled as homogeneous
anisotropic layers
with axis of symmetry perpendicular to the layering.
The only difference
between the two models in Figure ![[*]](http://sepwww.stanford.edu/latex2html/cross_ref_motif.gif) is in the
axis of symmetry the third layer.
Figure
is in the
axis of symmetry the third layer.
Figure ![[*]](http://sepwww.stanford.edu/latex2html/cross_ref_motif.gif) show the rays traced through these models for a source at 3500 ft.
show the rays traced through these models for a source at 3500 ft.
models
Figure 7 Anisotropic
layered models I used to test the ray
tracing. Two of the four homogeneous blocks are anisotropic
with orientation of the axes of symmetry indicated by the arrows.
The axis of symmetry
is perpendicular to
direction of fine layering. In both models, the layers 1 and 4 (from top to
bottom)
are isotropic. The third block of thin layers in the model at the left
( )can be the result of deposition in an eroded boundary
whereas
the same block in the model at the right
(
 )can be the result
of tilting after deposition over a plane boundary. The position
of the source is indicated by ``*''.


Next: CONCLUSIONS
Up: Michelena: ray tracing
Previous: TWO POINT RAY TRACING
Stanford Exploration Project
11/18/1997
![[*]](http://sepwww.stanford.edu/latex2html/cross_ref_motif.gif) a, where
rays have been traced in the simplest model: homogeneous isotropic.
When the model is transversely isotropic with vertical axis of symmetry,
the density of rays changes with angle, as Figure
a, where
rays have been traced in the simplest model: homogeneous isotropic.
When the model is transversely isotropic with vertical axis of symmetry,
the density of rays changes with angle, as Figure ![[*]](http://sepwww.stanford.edu/latex2html/cross_ref_motif.gif) b shows.
Figure
b shows.
Figure ![[*]](http://sepwww.stanford.edu/latex2html/cross_ref_motif.gif) c shows the rays paths in a homogeneous
transversely isotropic
model with axis of symmetry tilted with respect to the vertical (
c shows the rays paths in a homogeneous
transversely isotropic
model with axis of symmetry tilted with respect to the vertical (
